What the Saffir-Simpson Scale Measures
The Saffir-Simpson Hurricane Wind Scale is deceptively simple: it ranks hurricanes from 1 to 5 based on their maximum sustained wind speeds. That single metric determines the entire category, from Category 1 (74–95 mph, 119–153 km/h) through Category 5 (157+ mph, 252+ km/h).12 The scale focuses exclusively on wind because wind is measurable, repeatable, and closely correlated with structural damage to buildings.
The original scale included pressure and surge ranges. NHC tested a wind-only version in 2009 and made it operational in 2010. Surge depends on storm structure and coastal conditions, so it cannot be assigned a dependable range from category alone.1
Think of it like using speed limits on roads. You know what 65 mph (105 km/h) means regardless of where you are, but the actual danger depends on the road, weather, and traffic. The scale works the same way: it gives you a baseline, but local conditions determine the real impact.
The History Behind the Scale
In the early 1970s, Herbert Saffir, a structural engineer, and Robert Simpson, the director of the National Hurricane Center, developed the scale that still bears their names.3 Saffir was tasked with helping engineers and planners understand what wind speeds meant in practical terms. How much damage would buildings sustain at 100 mph (161 km/h)? 150 mph (241 km/h)? 170 mph (274 km/h)? Simpson, meanwhile, needed a way to communicate hurricane risk to the public and emergency managers in a way that was intuitive and actionable.
The five categories describe increasing potential for wind damage. They are not universal building-failure thresholds, and other regions use different tropical-cyclone classification systems.
Removing pressure and surge from the scale separated the wind category from hazards requiring their own forecasts. NHC’s modern categories are determined only by maximum sustained surface wind.
Category 1: Minimal to Moderate Damage
Winds: 74–95 mph (119–153 km/h)
Category 1 is the lowest hurricane category, but its winds can still cause serious damage.
Vulnerable roofs, siding, trees, and power lines can be damaged. The outcome for a building depends on its construction, maintenance, exposure, and the duration of strong winds.
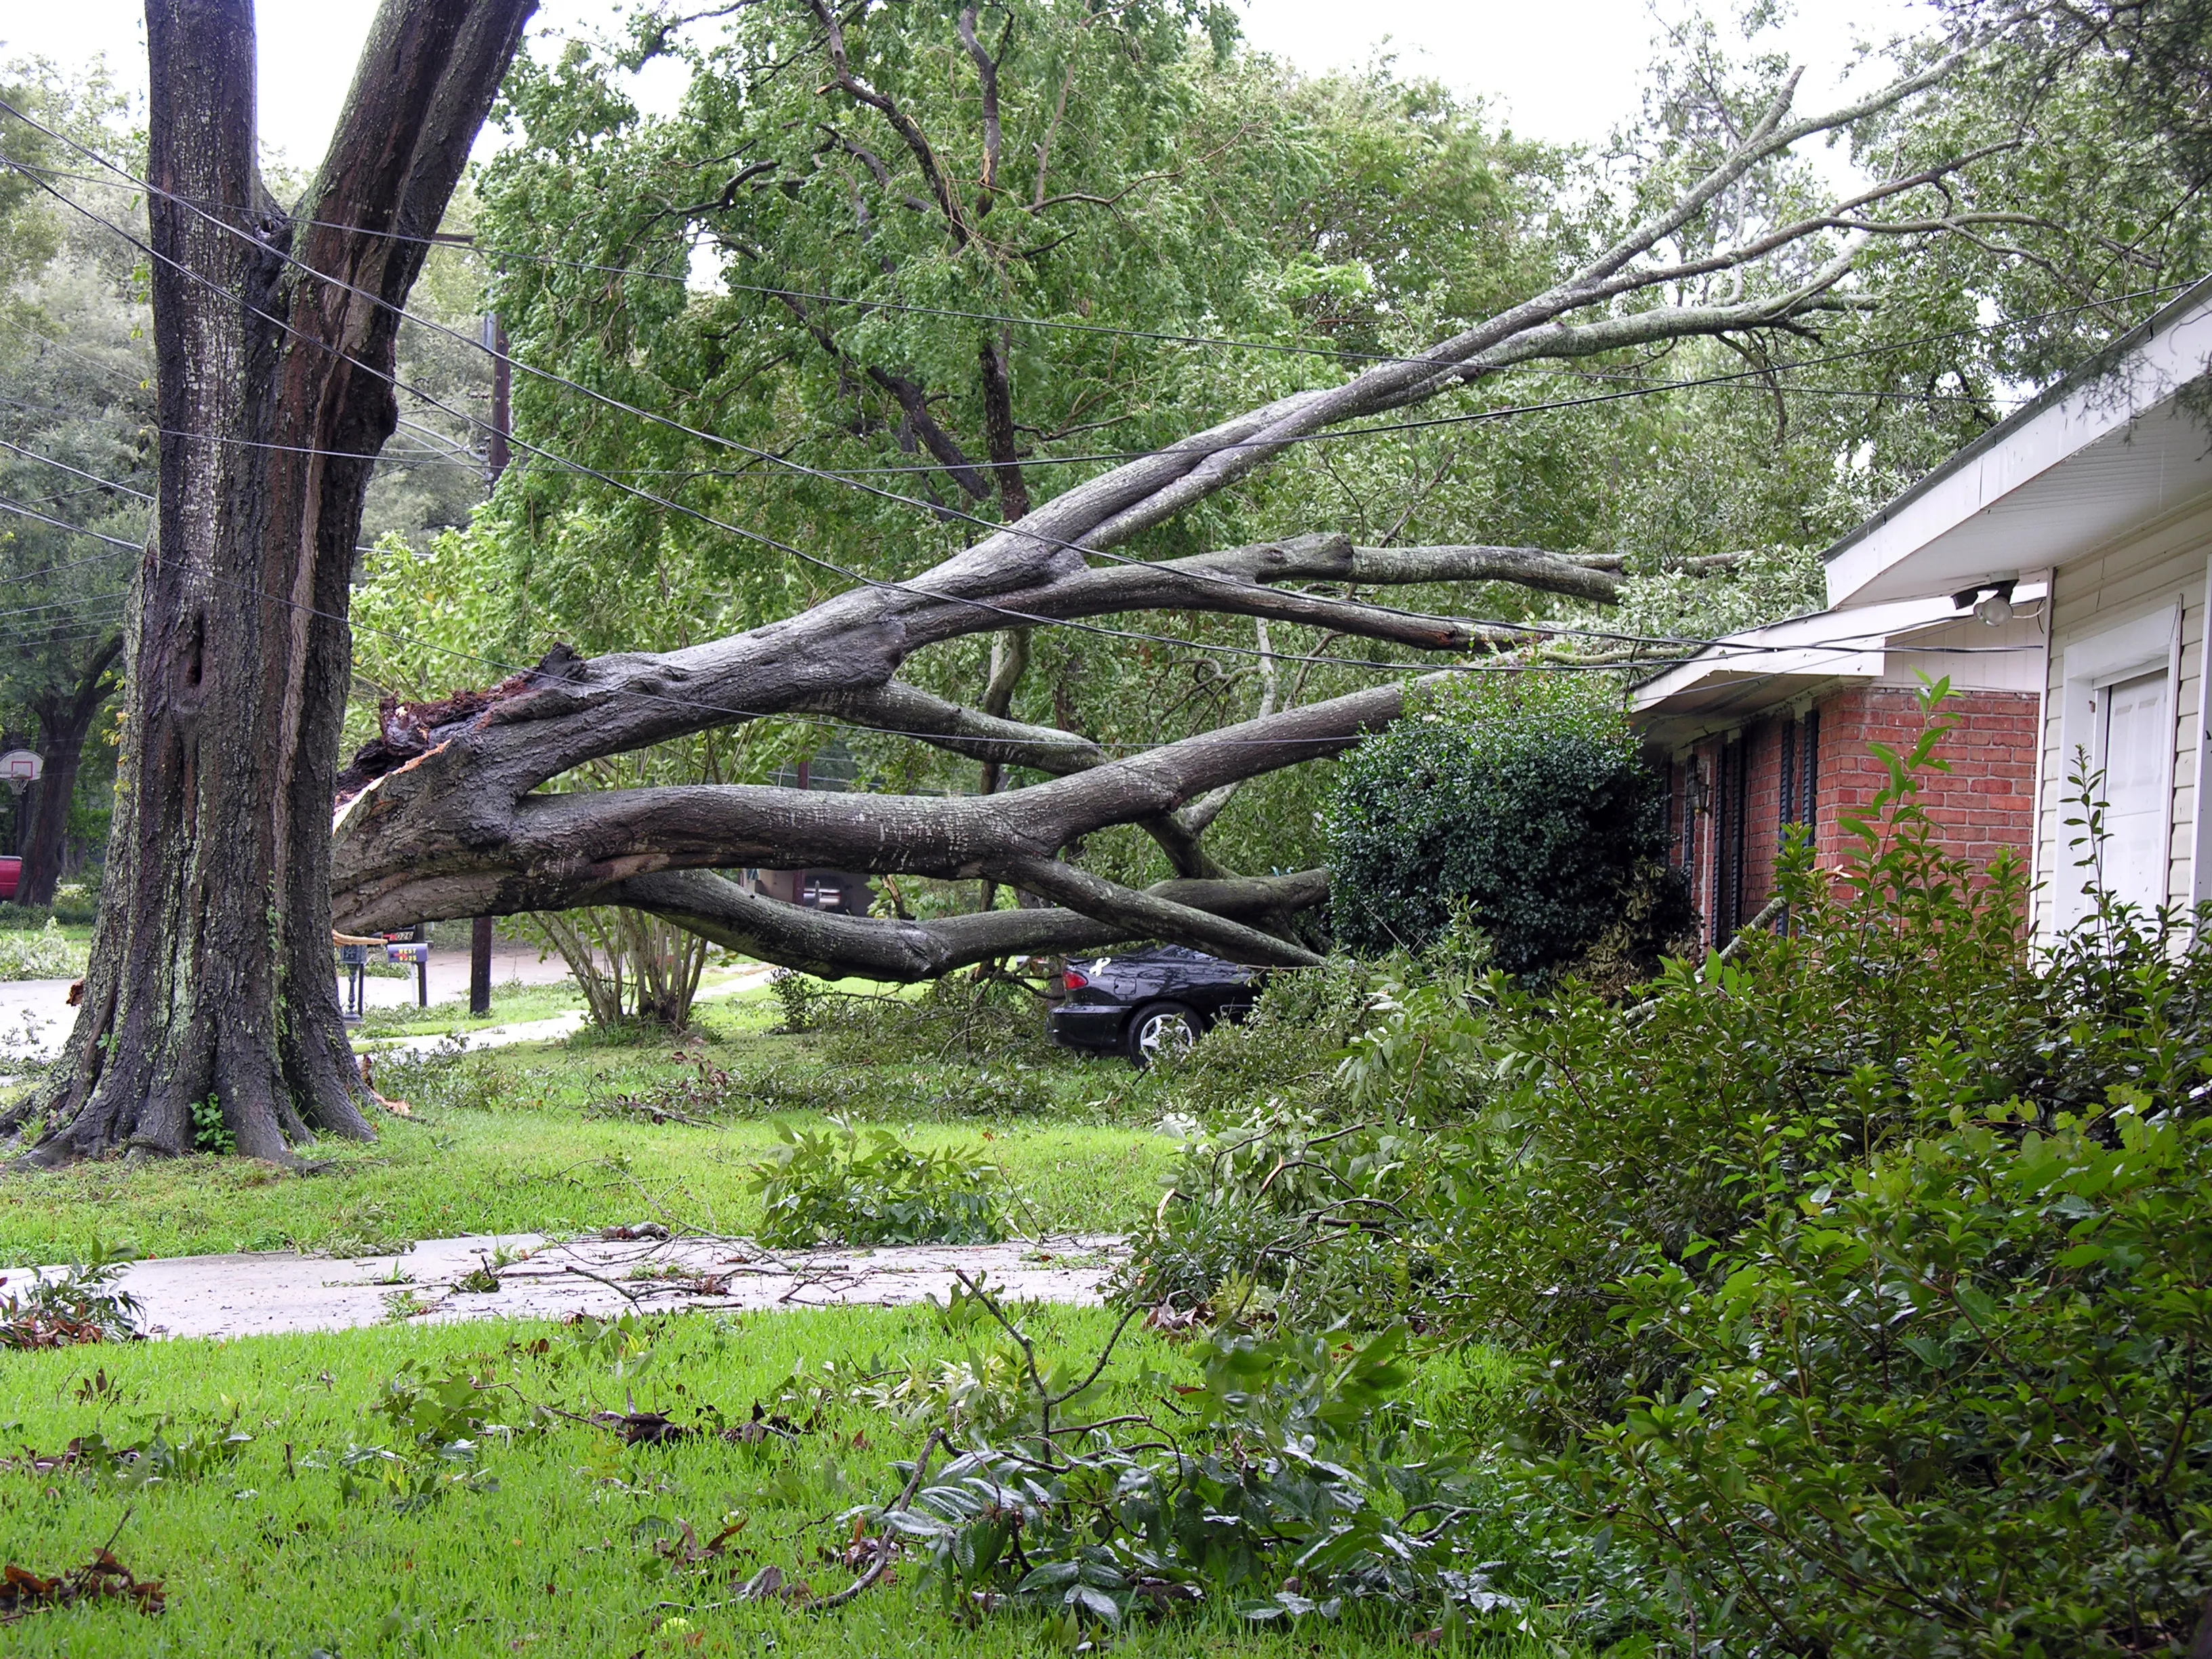
Category 1 hurricanes should not be dismissed. Irene (2011) and Florence (2018) brought destructive inland flooding despite making their U.S. landfalls at Category 1 strength.
Category 2: Extensive Damage
Winds: 96–110 mph (154–177 km/h)
Category 2 winds increase the potential for roof damage, tree falls, and lengthy power outages. These are broad damage descriptions, not a prediction that every structure will suffer the same loss.
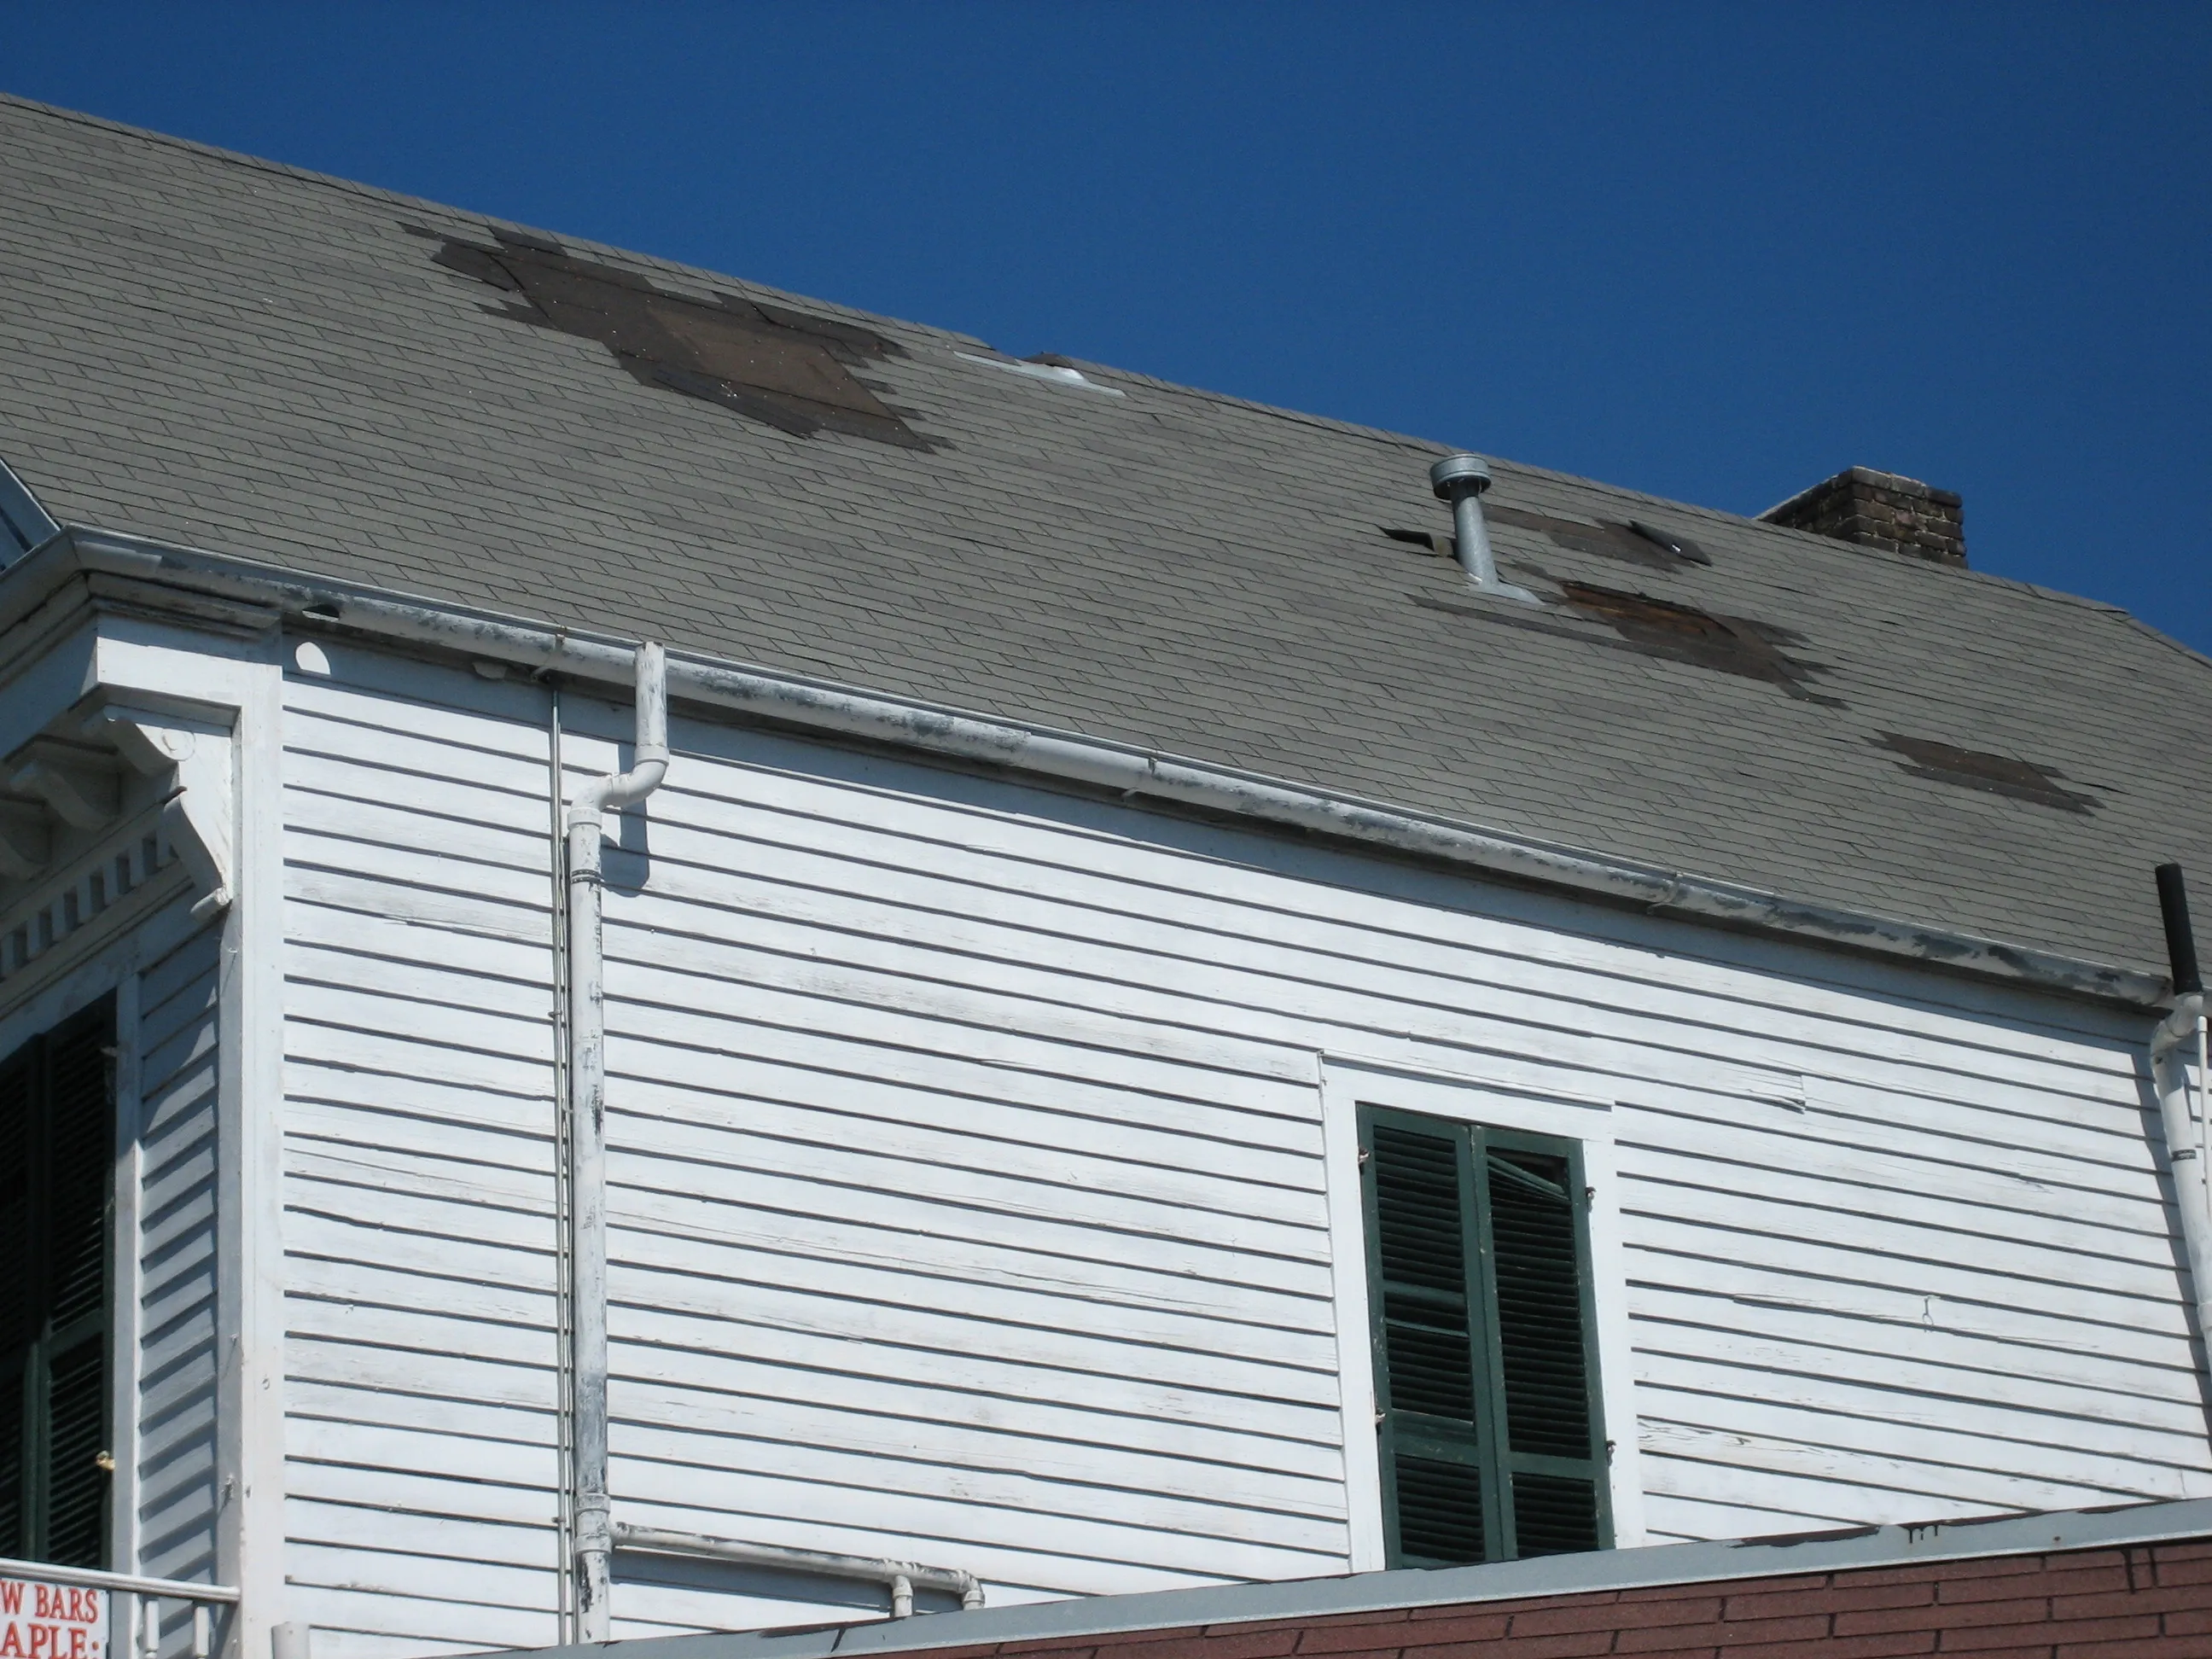
Construction quality and local exposure matter at every category. Flooding can be dangerous in tropical storms as well as hurricanes; Category 2 is not a threshold for flood risk.
Follow local evacuation instructions and hazard forecasts. Evacuation decisions are not triggered automatically by a particular category.
Category 3: Major Damage
Winds: 111–129 mph (178–208 km/h)
Category 3 is the start of the major-hurricane classification. Substantial wind damage is possible, including serious roof damage to framed homes.
Tree and utility damage can disrupt essential services. How long an area remains without power or water depends on the damage and the recovery response.
Storm surge can be life-threatening well below Category 3. There is no category at which surge first becomes dangerous, and no fixed surge-height range belongs to this category.
Category 4: Extreme and Catastrophic Damage
Winds: 130–156 mph (209–251 km/h)
Category 4 winds can cause severe structural damage, including loss of roof sections and exterior walls. Building design and condition still affect performance.
Wind-resistant construction can reduce damage, but a wind category alone cannot certify a building as safe to occupy. Flood exposure and evacuation instructions remain separate considerations.
Charley (2004) illustrates the destructive wind hazard of a compact Category 4 hurricane. Its wind category does not define a typical surge height.
Major-hurricane landfalls are less frequent than weaker landfalls, but local preparedness should be based on risk rather than an undated count of past events.
Category 5: Catastrophic Destruction
Winds: 157+ mph (252+ km/h)
Category 5 is the highest category and has no upper wind-speed limit. It describes the potential for catastrophic wind damage, not certain destruction of every building.
Extensive tree, utility, and building damage can isolate communities and make them uninhabitable for an extended period. Recovery times vary.
The four recorded Category 5 continental U.S. landfalls through 2025 are the 1935 Labor Day hurricane, Camille (1969), Andrew (1992), and Michael (2018). Their other hazards differed; Category 5 has no prescribed surge range.
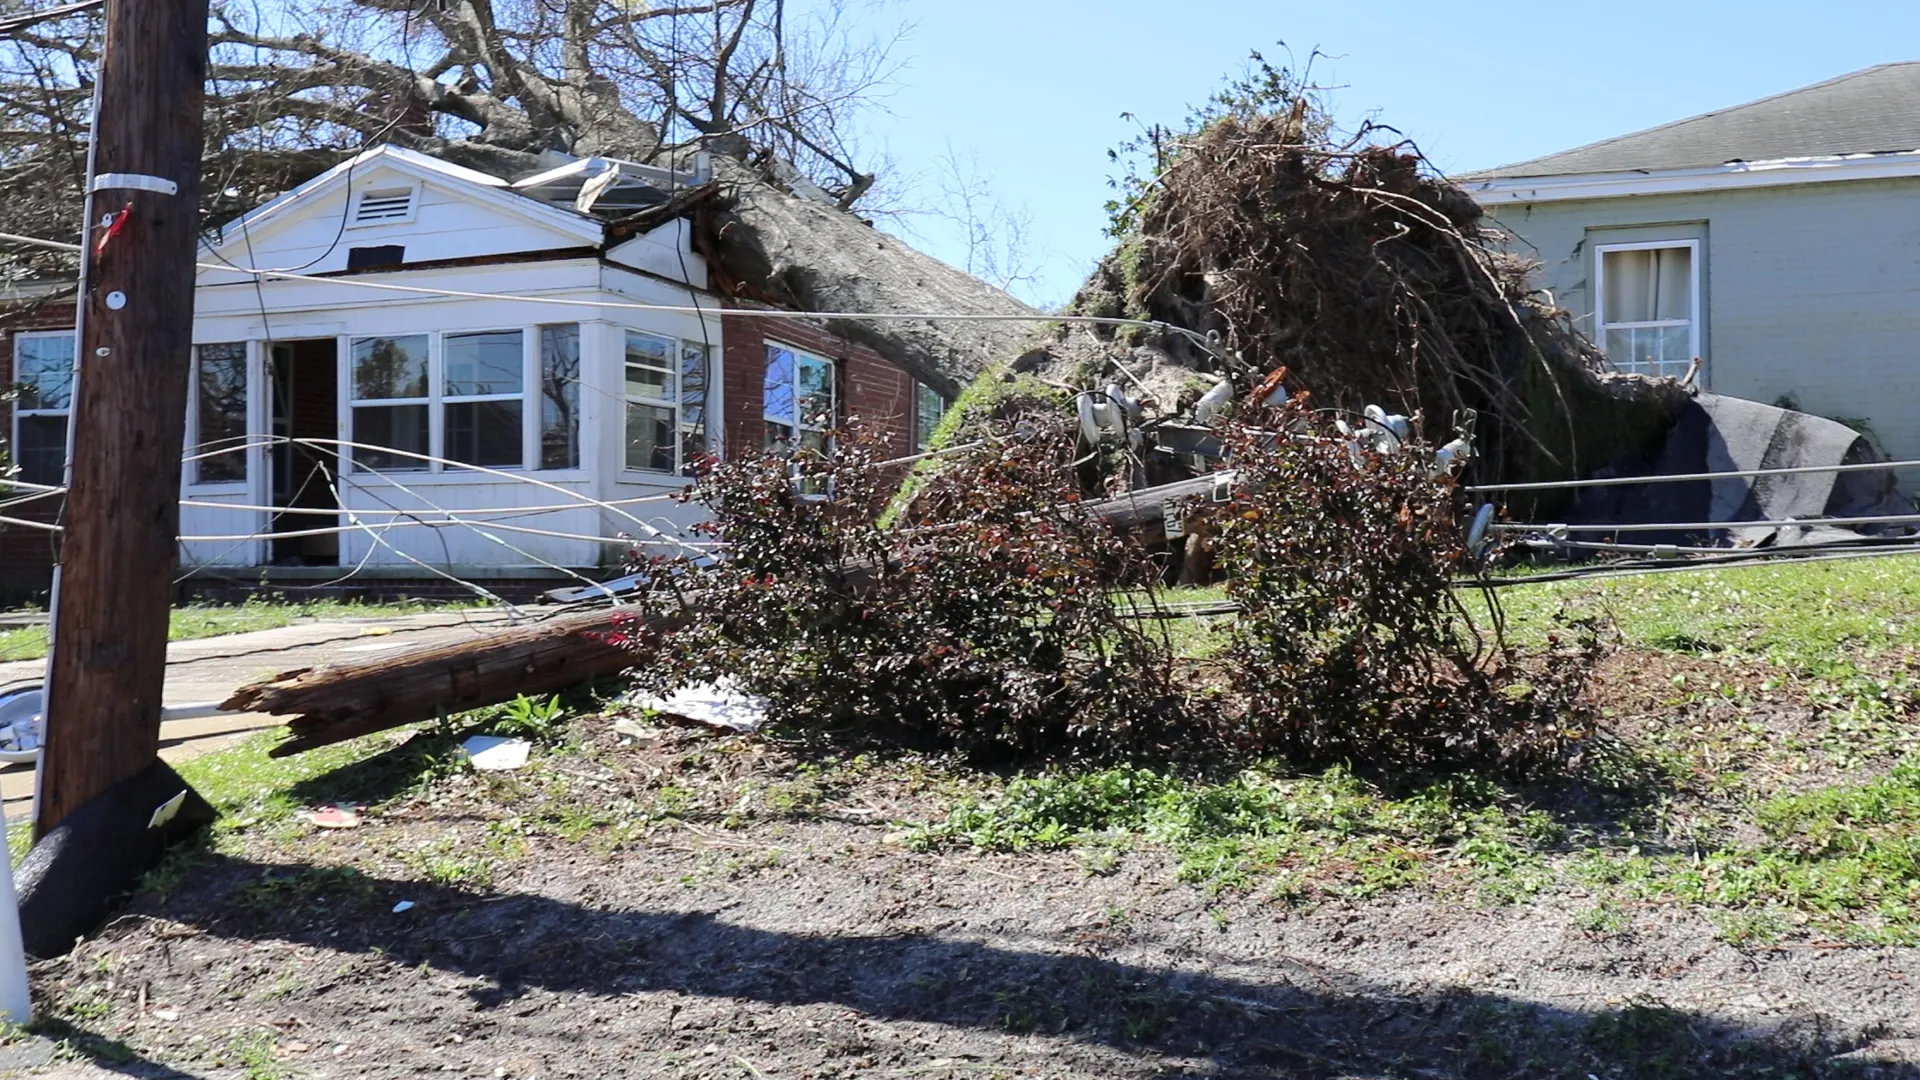
Wind loading: At a fixed air density and drag coefficient, pressure on a surface scales approximately with the square of wind speed. For example, doubling the speed gives four times the pressure. That is a quadratic relationship, not an exponential law for damage; structural failure also depends on the building and load path.
What the Scale Does NOT Measure
The Saffir-Simpson scale measures one thing: wind speed. This is both its strength and its weakness. Wind speed is easy to communicate and understand. But a hurricane is not just wind. A hurricane is also storm surge, rainfall, and storm duration. These factors often cause more damage than wind alone.
Storm surge: Wind stress and lower atmospheric pressure raise coastal water levels. Storm size, track, speed, and coastal geometry influence the response. Consult the surge forecast, not a category-to-height conversion.4
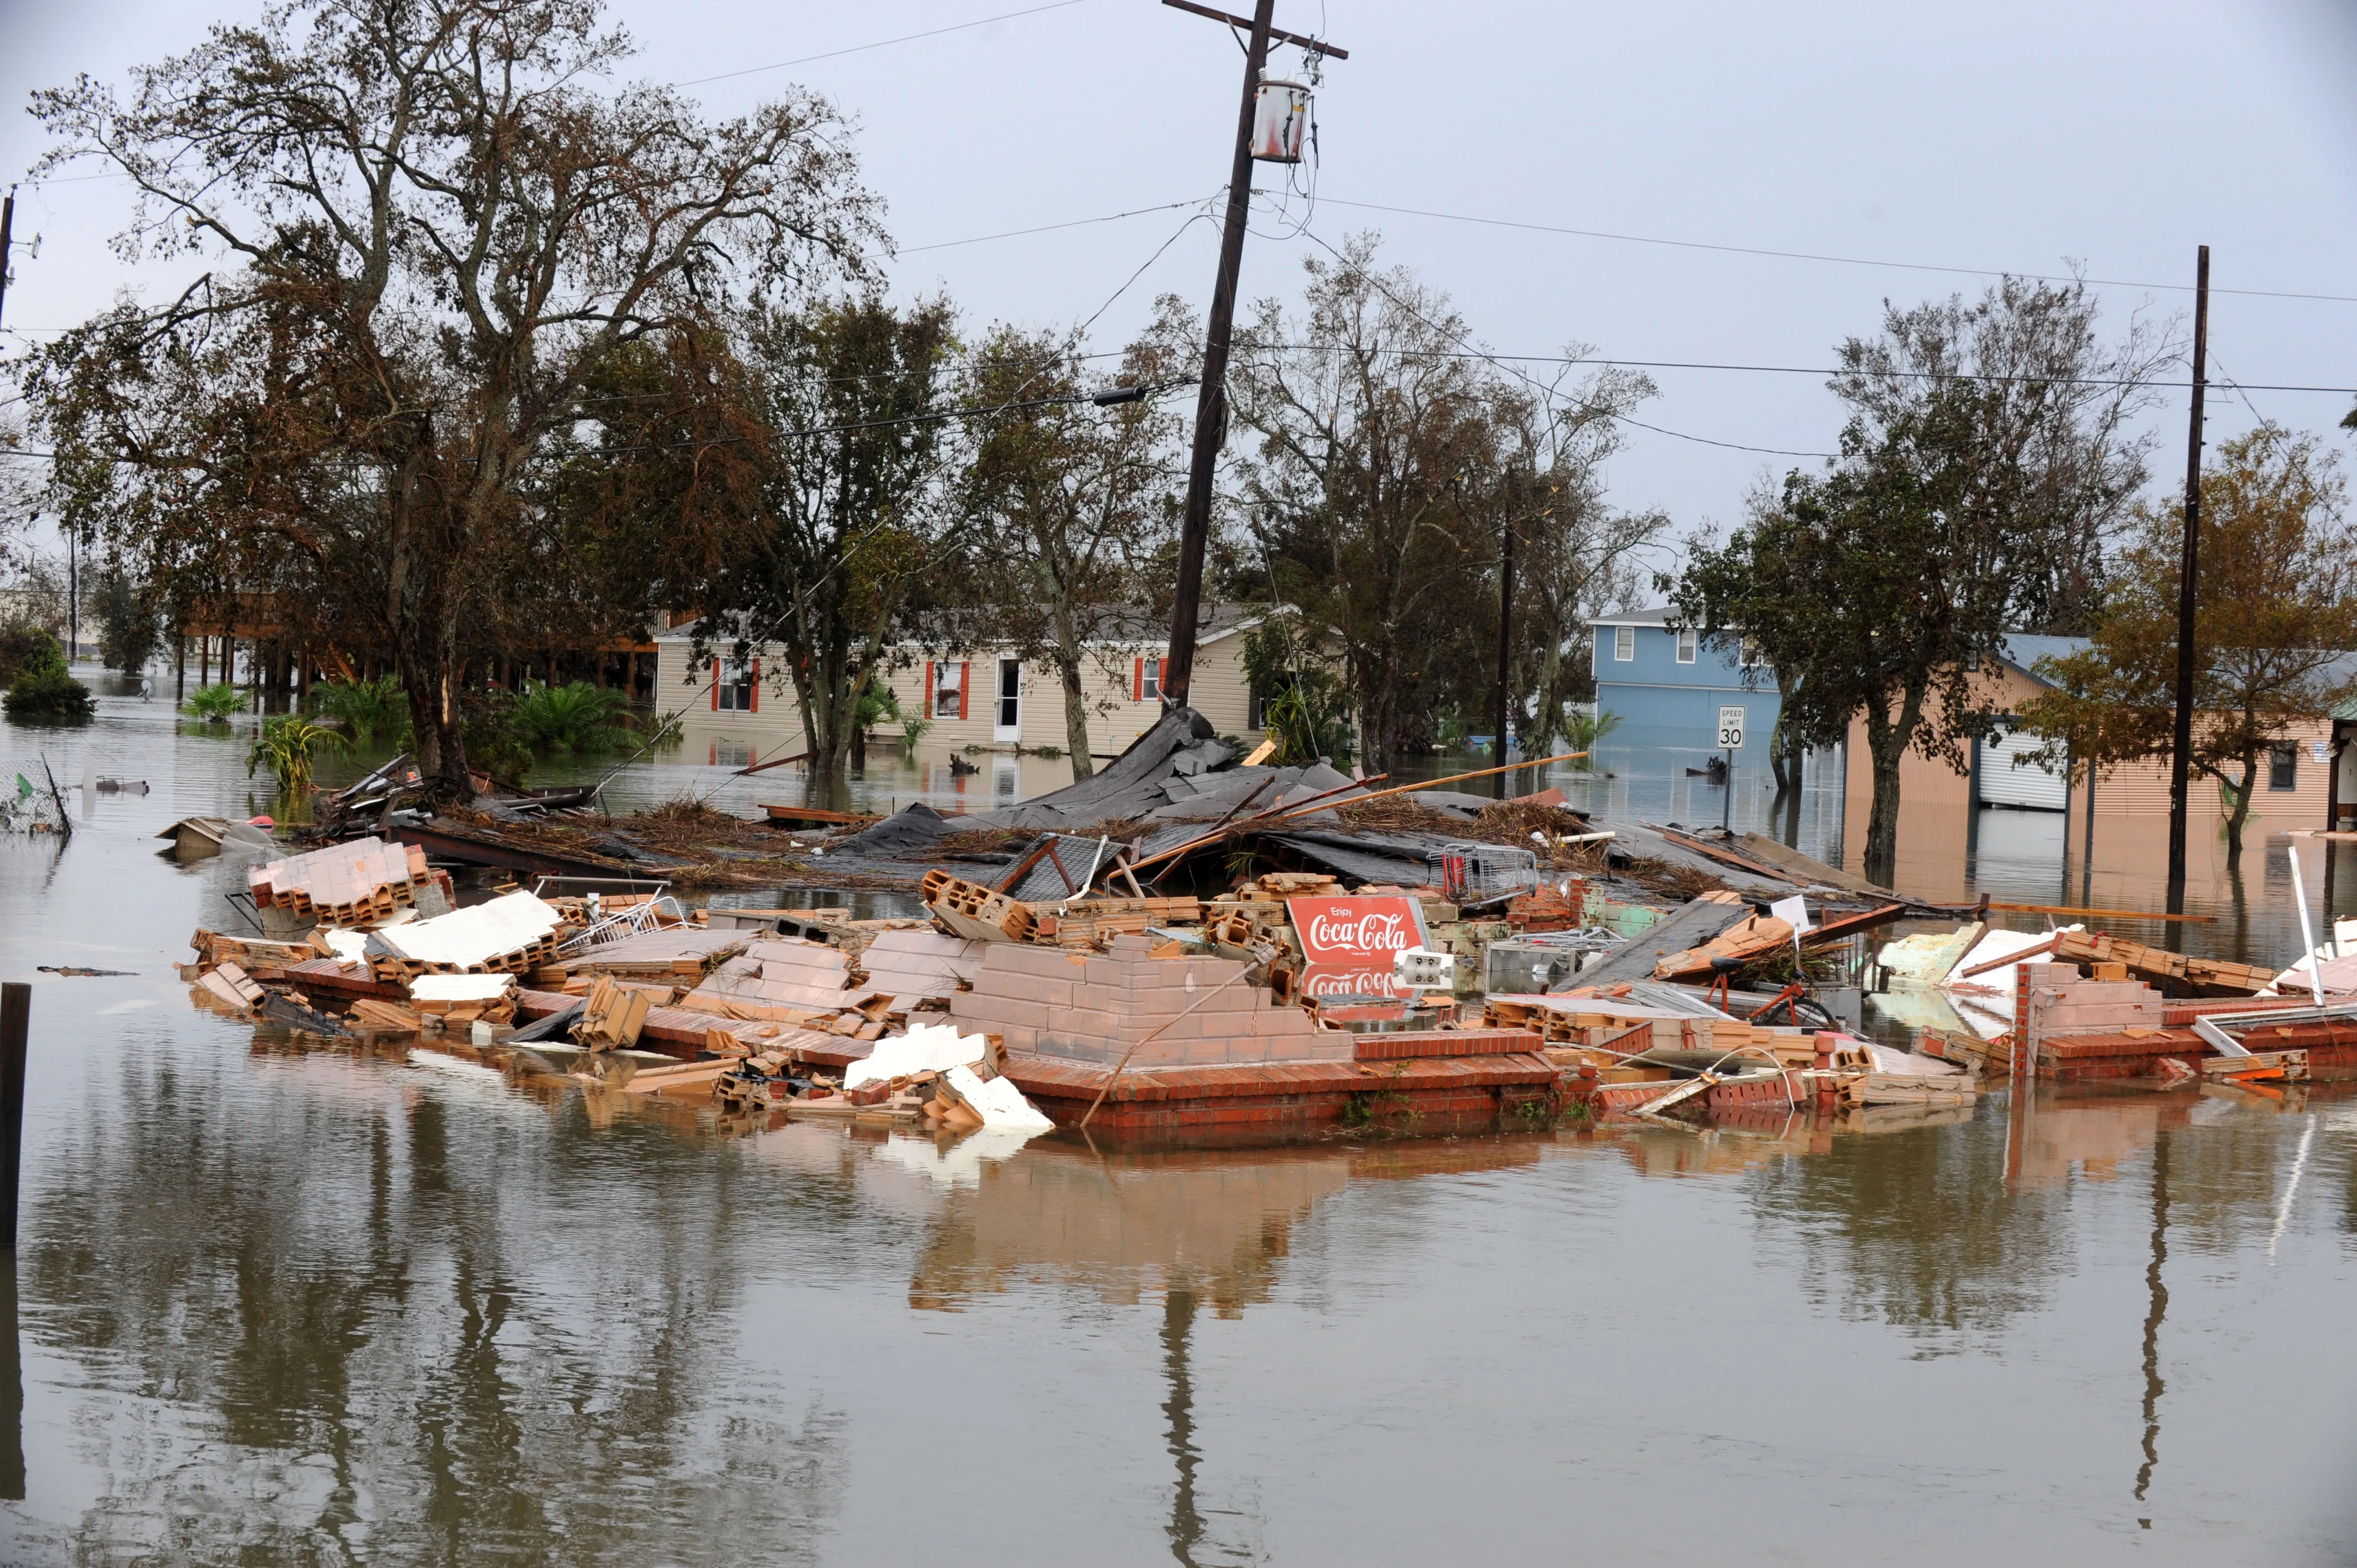
Rainfall and flooding: Freshwater floods can be catastrophic far inland, including during tropical storms. A comparison of deaths by hazard must state its time period and whether it counts direct or indirect deaths.
Hurricane Size: A small, intense Category 3 might affect only a 50-mile (80 km) stretch of coast, while a sprawling Category 2 with a massive circulation affects hundreds of miles. The scale does not account for the geographic extent of damaging winds.
To communicate these other hazards, the National Hurricane Center now issues separate products, including Potential Storm Surge Flooding maps and dedicated Storm Surge Watches and Warnings (introduced in 2017). But these remain less familiar to the public than the Saffir-Simpson scale. Many people still think "Category X" tells them everything they need to know about a hurricane's danger.
The Category 6 Debate
Category 5 is open-ended: a 160 mph hurricane and a 185 mph hurricane receive the same category. Neither exceeds an upper bound of the scale.
Researchers have proposed additional categories to communicate extreme intensity, but Category 6 is not part of the official NHC scale. Proposed scales should be distinguished from operational warnings.
Whatever terminology is used, take the forecast wind, surge, rainfall, and local evacuation instructions seriously.
Why Lower Categories Still Kill
Lower-category storms can kill through flooding, falling trees, and other hazards. Their share of deaths depends on the time period and dataset; no universal majority claim is justified here.
A Category 1 produces significant rainfall, dangerous storm surge in the right circumstances, and wind strong enough to uproot trees and destroy power lines. These hazards interact with vulnerable infrastructure and vulnerable populations. A Category 1 in a densely populated coastal area with old buildings, flood-prone neighborhoods, and limited evacuation routes can be as deadly as a Category 3 in a less populated area with newer construction and efficient evacuation.
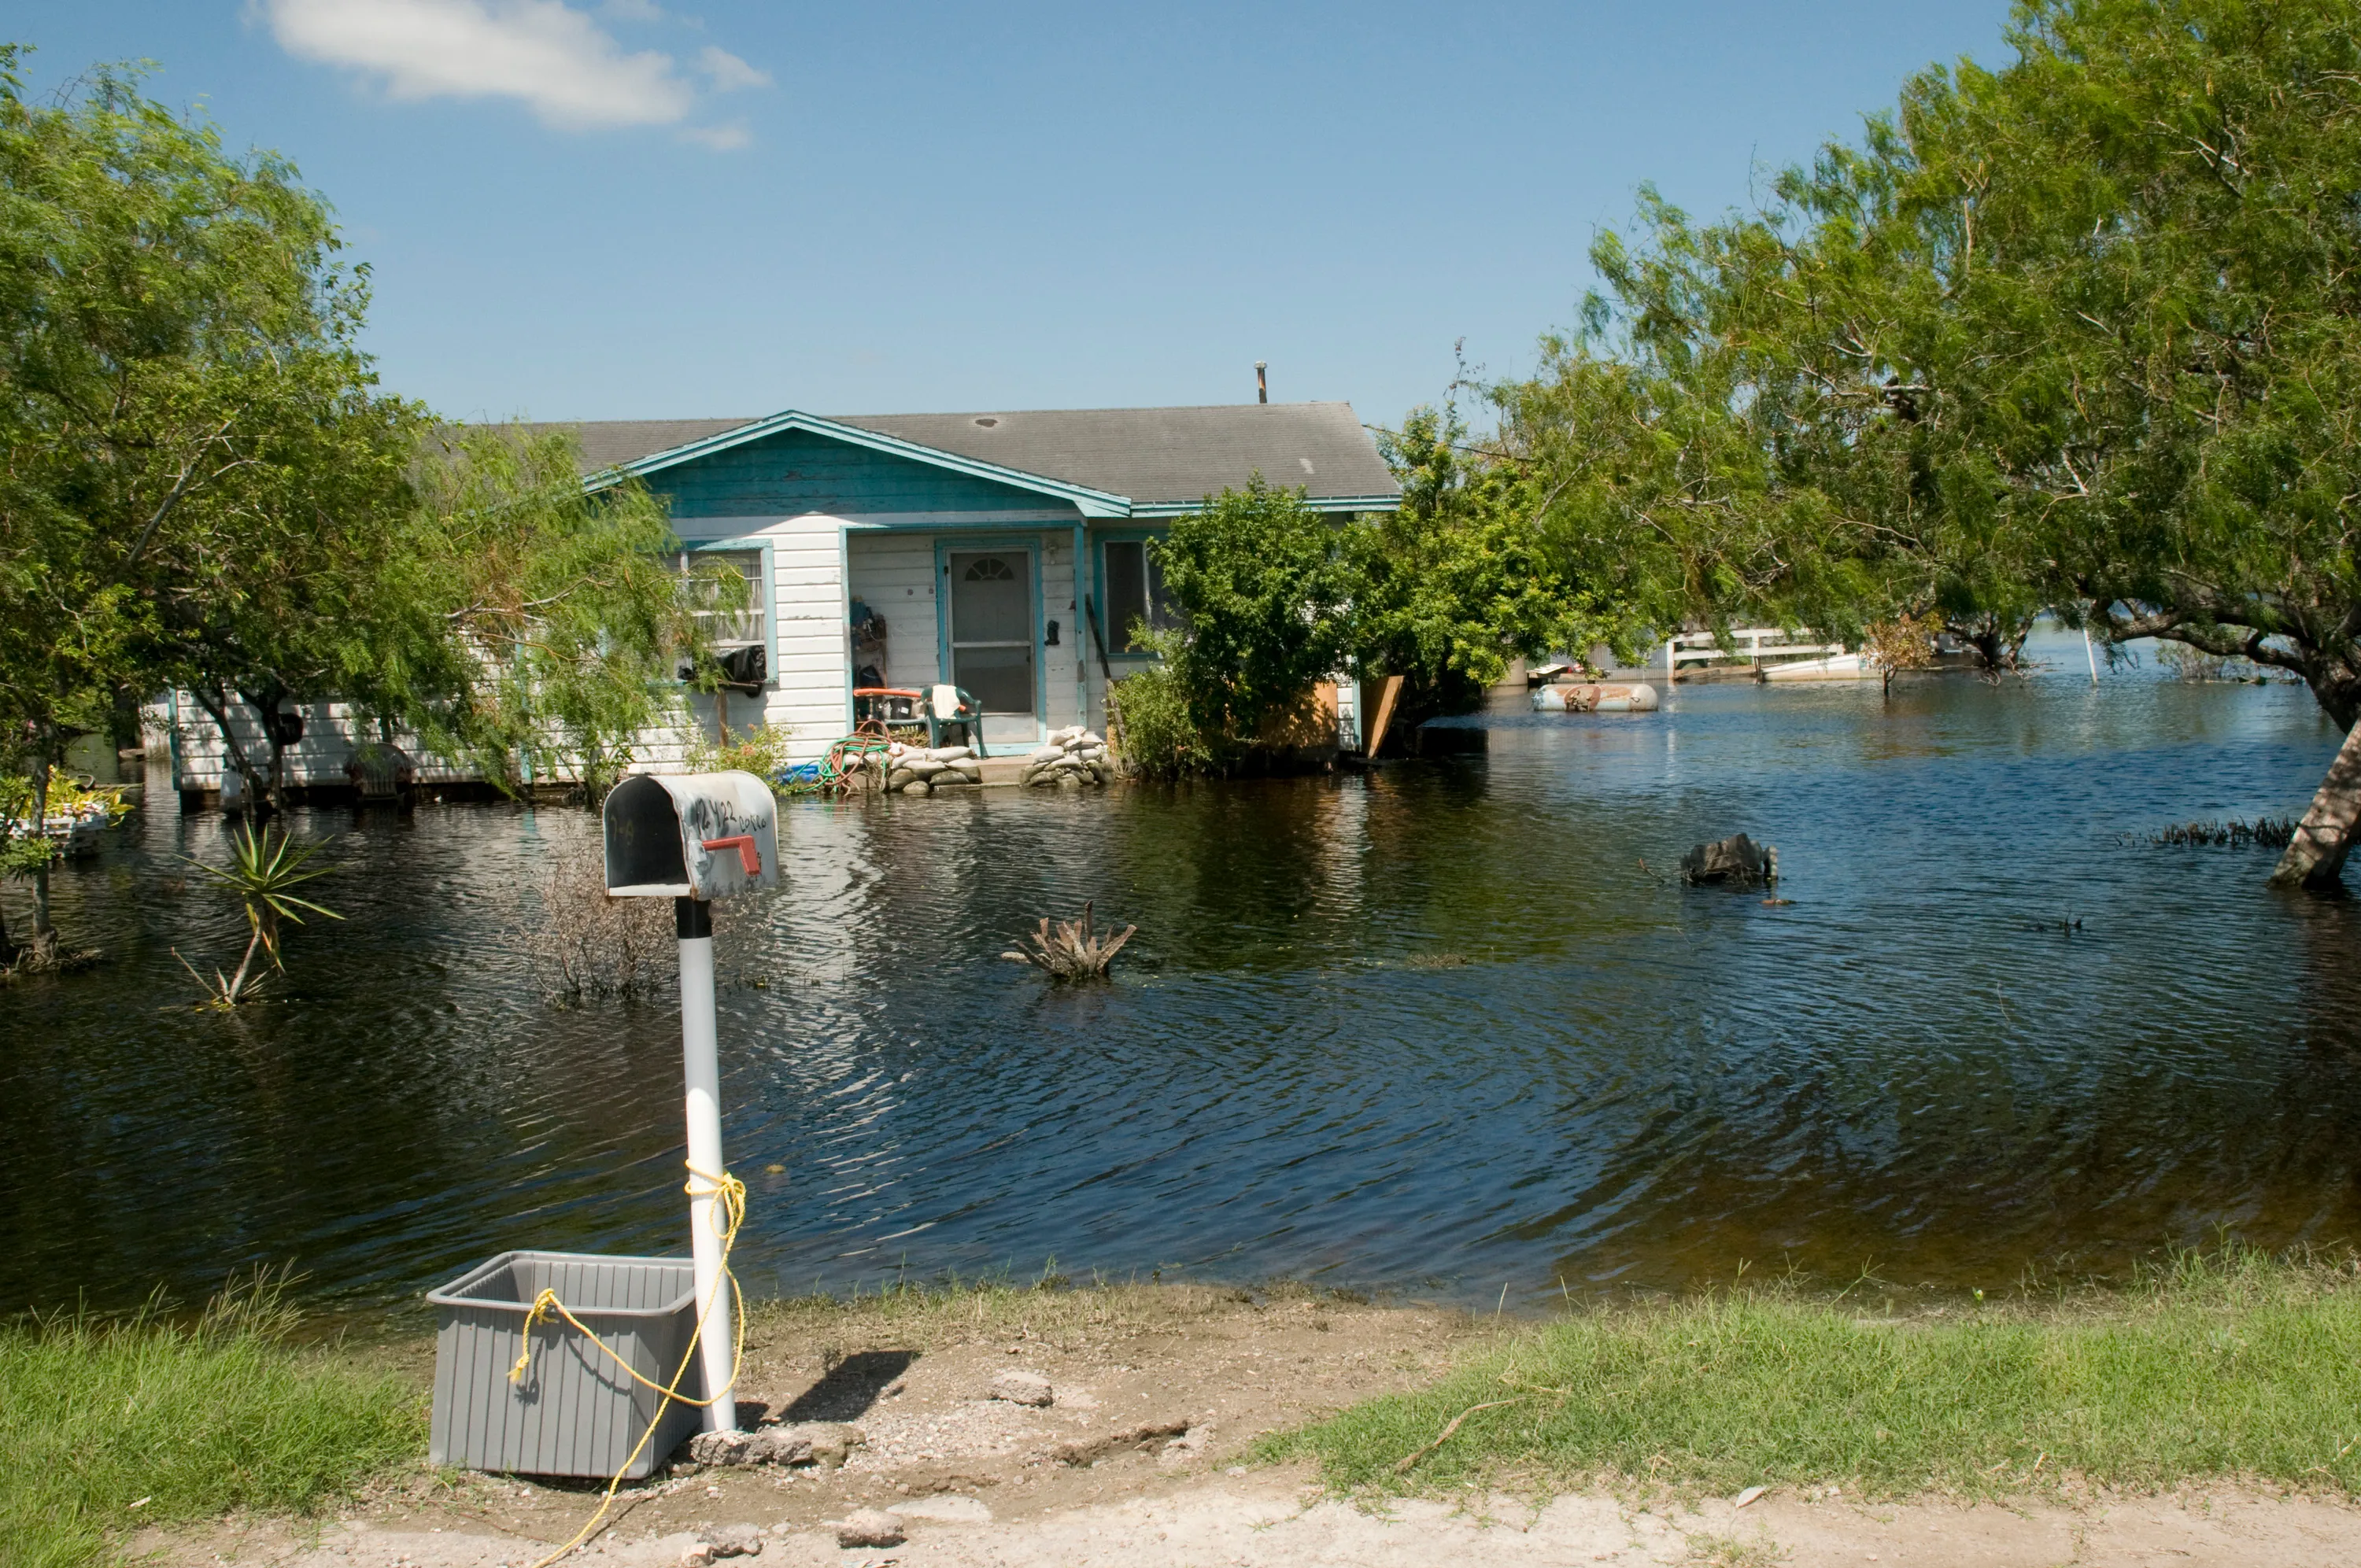
The Saffir-Simpson scale, by focusing on wind, inadvertently elevates wind as the primary hazard. In reality, rainfall and surge kill more people. A Category 1 hurricane should never be dismissed, even if it is not a Category 3.
Sources
-
Schott, T., Landsea, C., Hafele, G., et al. (2012). The Saffir-Simpson Hurricane Wind Scale. National Weather Service / National Hurricane Center. https://www.nhc.noaa.gov/pdf/sshws.pdf ↩ ↩2
-
National Hurricane Center. (2024). Saffir-Simpson Hurricane Wind Scale. NOAA. https://www.nhc.noaa.gov/aboutsshws.php ↩
-
Simpson, R. H. (1974). The hurricane disaster potential scale. Weatherwise, 27(4), 169–186. https://doi.org/10.1080/00431672.1974.9931702 ↩
-
Irish, J. L., Resio, D. T., & Ratcliff, J. J. (2008). The influence of storm size on hurricane surge. Journal of Physical Oceanography, 38(9), 2003–2013. https://doi.org/10.1175/2008JPO3727.1 ↩