Hurricane forecasting has improved dramatically over the past half-century. Five-day track forecasts today are about as accurate as three-day forecasts were a few decades ago, and average track errors have fallen by more than half since 1990, progress that has given coastal communities far more time to prepare and evacuate.1 That progress rests on a chain of technology that turns scattered observations into actionable forecasts.
Watching the Storm: Satellites
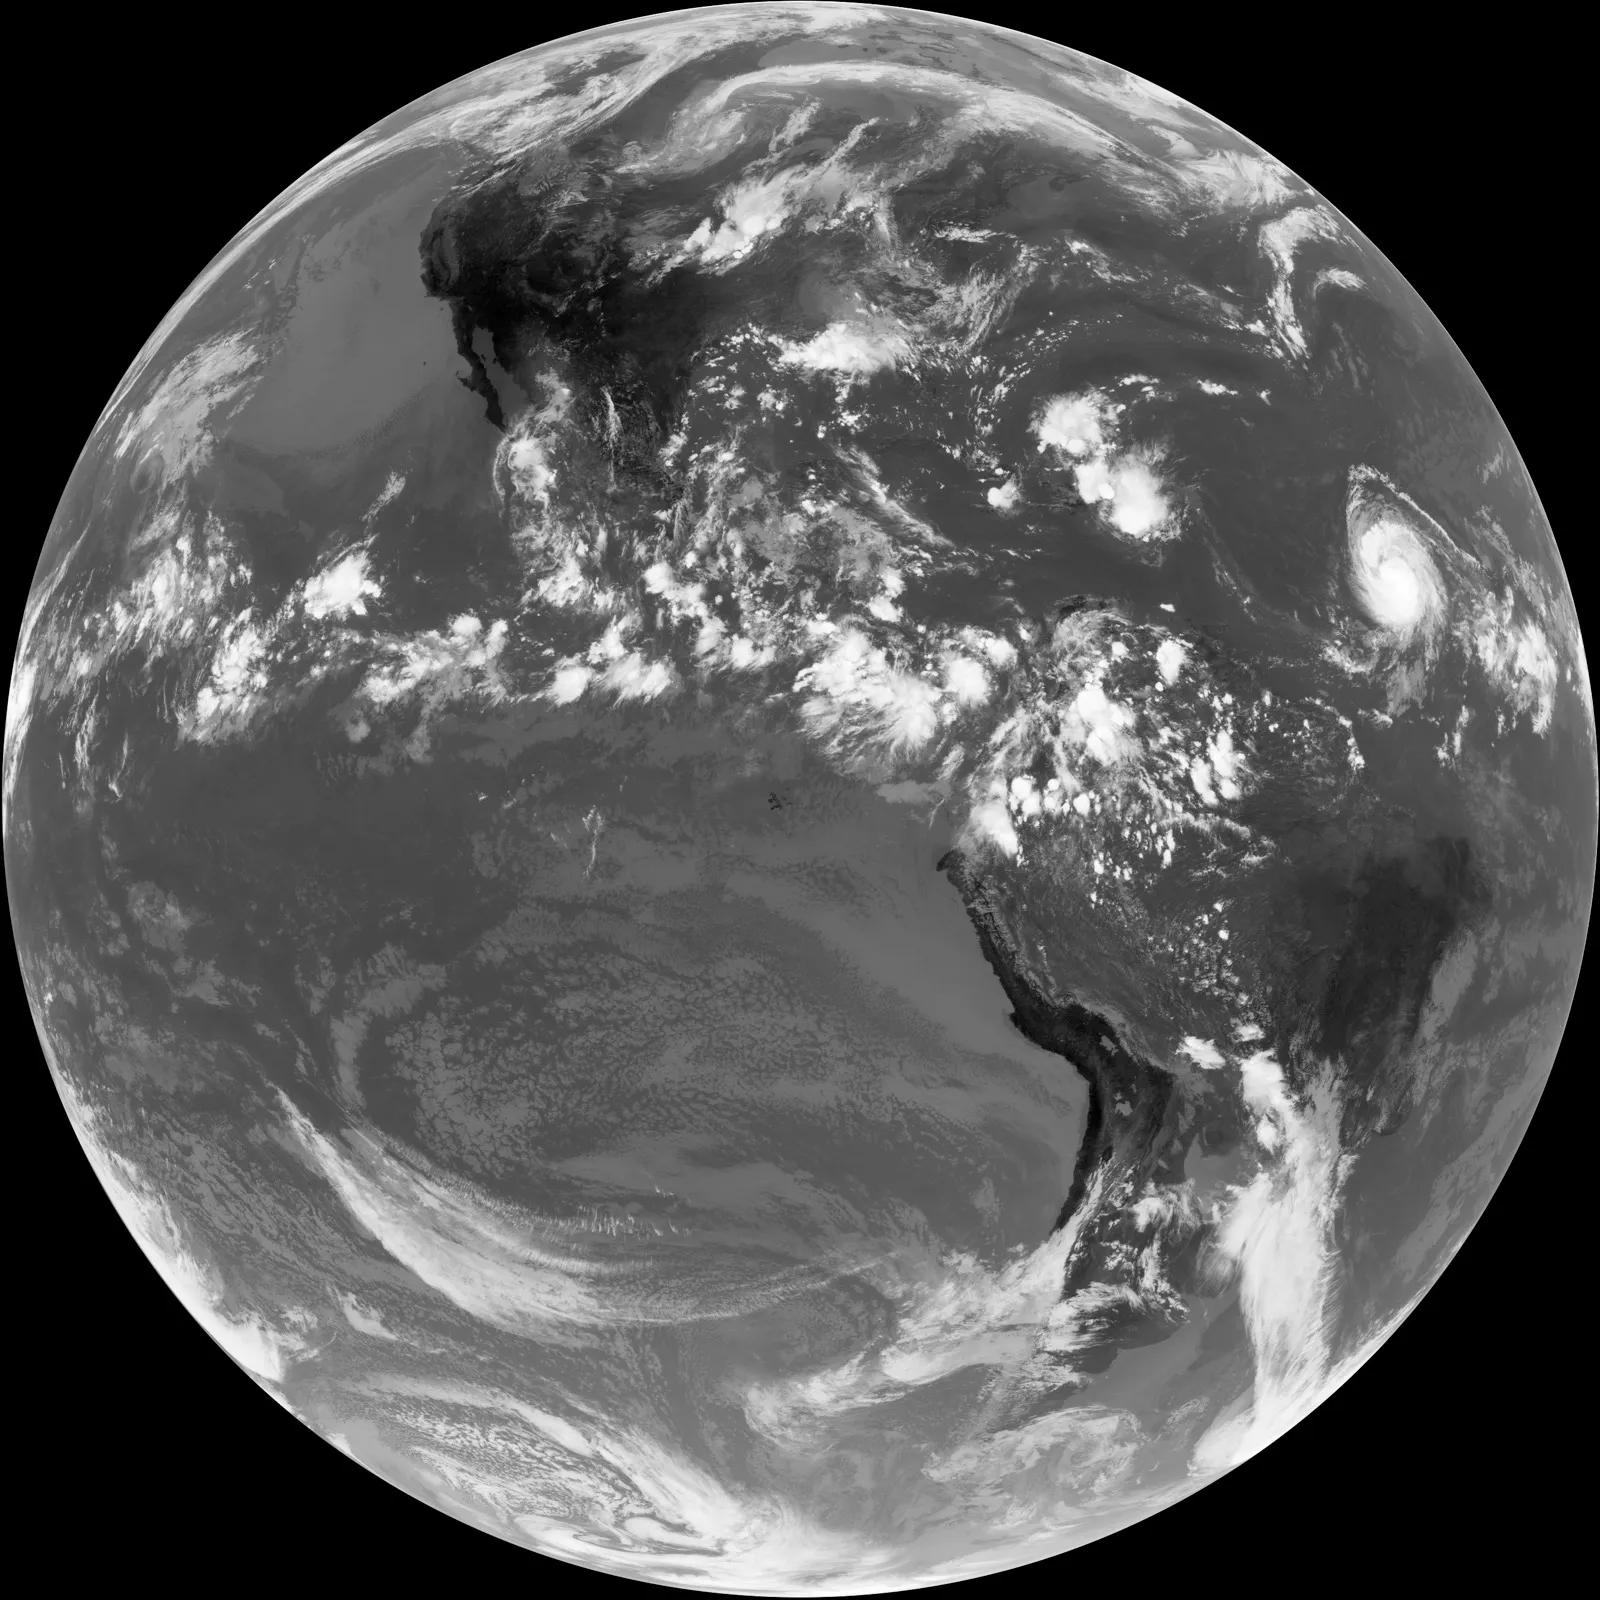
Satellites are the backbone of hurricane monitoring, especially over the open ocean where in-situ observations are sparse. Geostationary satellites such as NOAA's GOES series hover over a fixed point and image the Earth every few minutes, tracking a storm's position, structure, and rapid changes in near-real time.2 Polar-orbiting satellites add high-resolution passes and microwave data that can peer through clouds to reveal the eye and inner core. When direct measurements aren't available, forecasters estimate a storm's intensity from the imagery alone using the Dvorak technique, which relates cloud patterns to wind speed.1
Flying Into the Storm: Hurricane Hunters
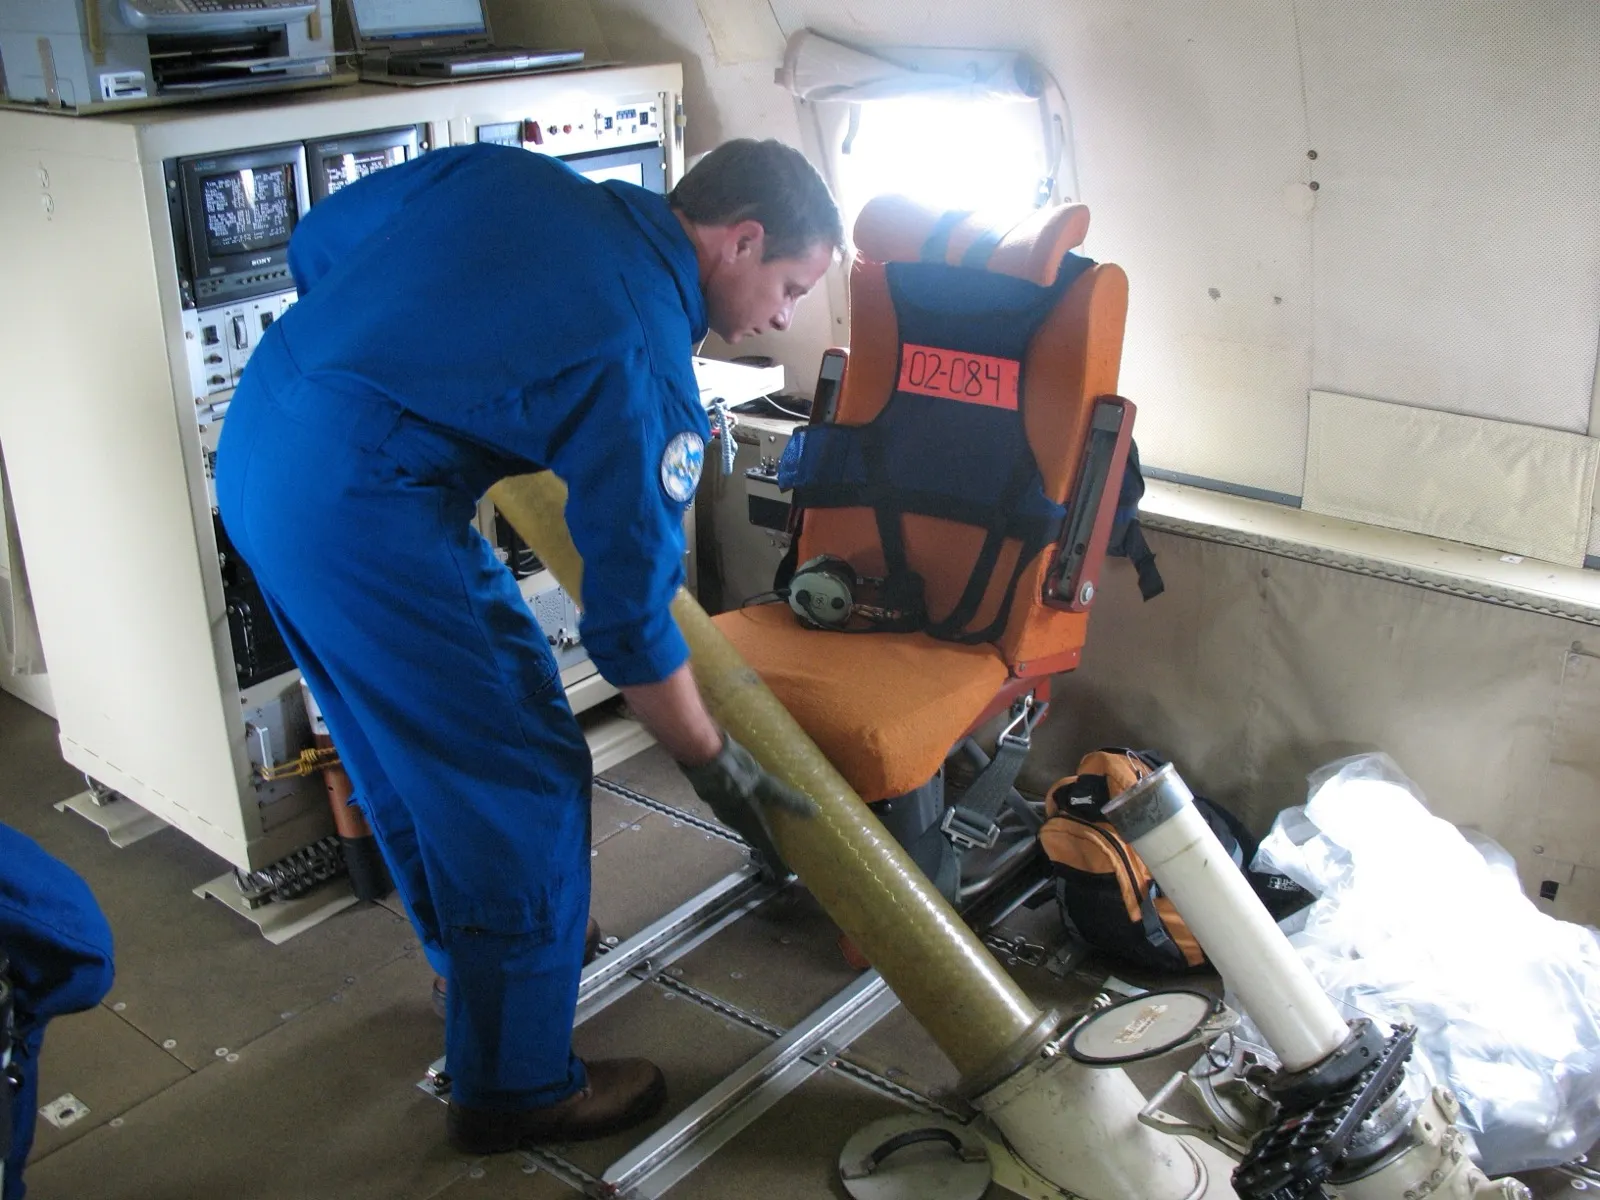
Satellites can't directly measure the wind and pressure inside a hurricane, so Hurricane Hunter aircraft fly through it. NOAA's WP-3D Orions and the Air Force Reserve's WC-130J aircraft penetrate the eyewall and release dropsondes, instrument packages that radio back temperature, humidity, pressure, and wind as they parachute to the sea.1

Tail Doppler radar aboard the aircraft maps the storm's three-dimensional wind field. This in-storm data measurably improves forecasts: feeding aircraft observations into the models has been shown to reduce track and intensity errors.3 It's the part of the job that keeps crews flying into the eyewall in the first place, because aircraft provide detailed profiles and inner-core observations that complement satellite retrievals.
Predicting the Path: Numerical Models
The heart of modern forecasting is numerical weather prediction: supercomputers solving the physics of the atmosphere. Forecasters consult global models like the American GFS and the European ECMWF, along with hurricane-specific, high-resolution models such as HAFS.2 Because no single model is perfect, forecasters run ensembles (many slightly different model runs) and compare the "spaghetti" plots of their tracks; agreement signals confidence, and divergence signals uncertainty.1
Read a spaghetti plot together with the official forecast and its uncertainty information. The lines come from different model forecasts or ensemble members; they are not necessarily independent or equally reliable. Agreement is useful context, but a tight cluster does not guarantee the track.
The NHC Forecast Process and the Cone
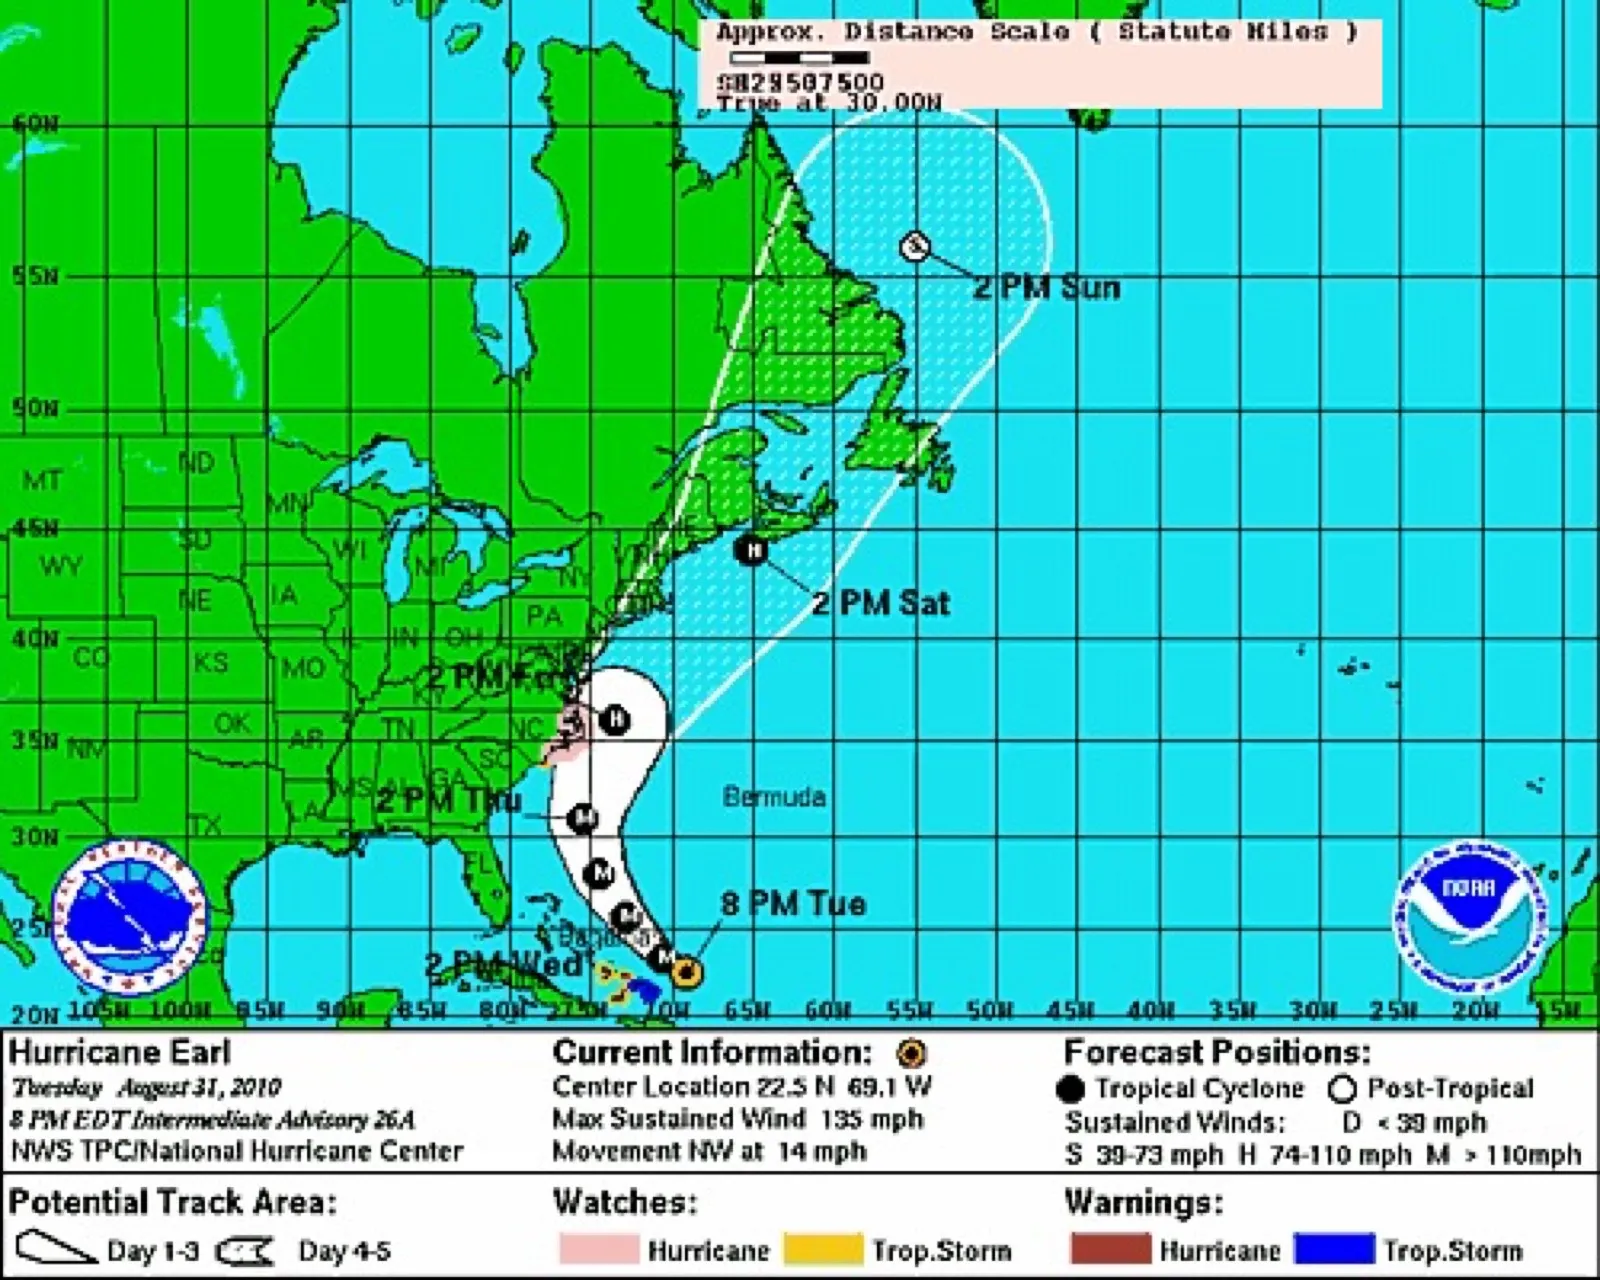
The NHC normally issues full advisory packages every six hours, with intermediate or special advisories as needed. Track and intensity forecasts extend through five days. Hurricane watches and warnings are generally issued 48 and 36 hours, respectively, before the expected onset of tropical-storm-force winds, because preparations become hazardous before hurricane-force winds arrive. Separate products address surge and other hazards.4
Intensity: the Hard Problem
Both track and intensity forecasts have improved over the long term, although errors fluctuate between seasons. Rapid intensification—at least 30 knots in maximum sustained wind over 24 hours—remains challenging. Inner-core structure, shear, moisture, and ocean conditions all affect the outcome. Consult current NHC verification reports rather than assuming that intensity forecasts have not improved.5
A Track Record of Improvement
The long-term trend is one of steady, hard-won gains: better satellites, more aircraft data, faster computers, and smarter models have together transformed hurricane forecasting from a few hours' warning into a multi-day outlook. The 2017 addition of dedicated storm-surge watches, warnings, and inundation maps extended that progress to the deadliest hurricane hazard.1 Useful lead time can support protective action when warnings reach people and they have the means to respond.
Sources
-
National Hurricane Center. Definition of the NHC Track Forecast Cone. NOAA. https://www.nhc.noaa.gov/aboutcone.shtml ↩ ↩2 ↩3 ↩4 ↩5
-
National Oceanic and Atmospheric Administration (2023). NOAA launches new hurricane forecast model as Atlantic season starts strong. https://www.noaa.gov/news-release/noaa-launches-new-hurricane-forecast-model-as-atlantic-season-starts-strong ↩ ↩2
-
NOAA Atlantic Oceanographic and Meteorological Laboratory, Hurricane Research Division. Aircraft reconnaissance and hurricane model improvement. https://www.aoml.noaa.gov/hrd/ ↩
-
NHC. Glossary. https://www.nhc.noaa.gov/aboutgloss.shtml ↩
-
NHC. Forecast verification. https://www.nhc.noaa.gov/verification/verify3.shtml ↩