Aircraft observations complement satellites, radar and surface data. A reconnaissance mission samples selected parts of a storm; it does not replace the rest of the observing network.
Mission Planning and Tasking
Operational reconnaissance requirements are coordinated through the National Hurricane Operations Plan and CARCAH. NOAA also flies research missions; not every scientific flight is individually requested by NHC.1
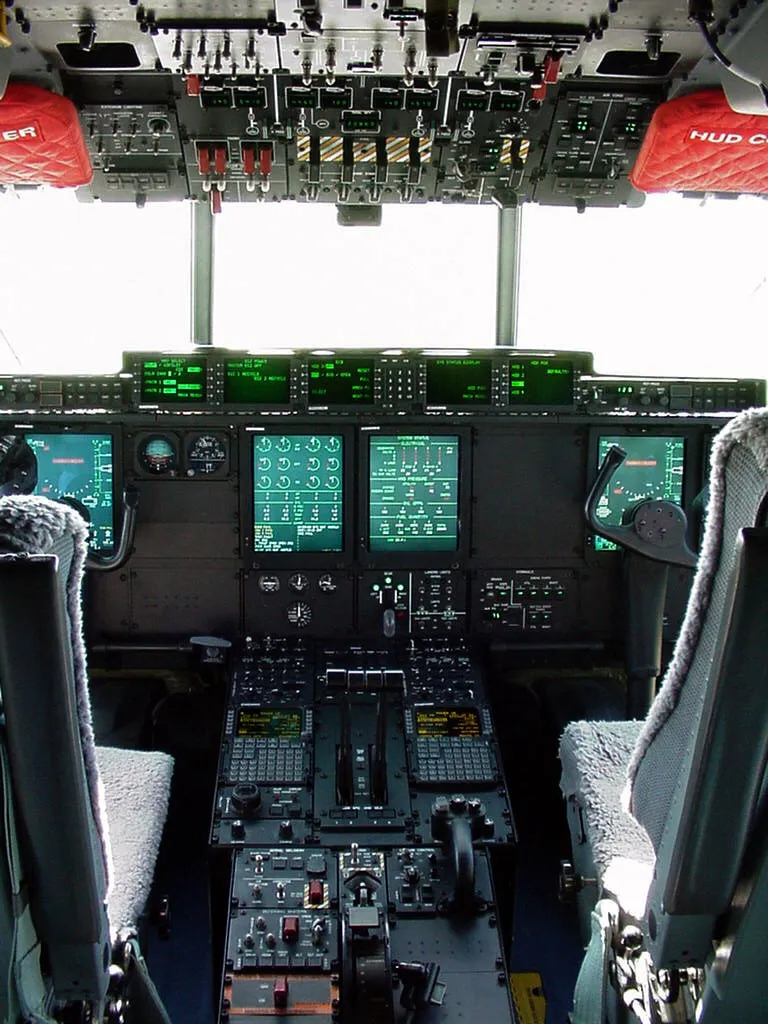
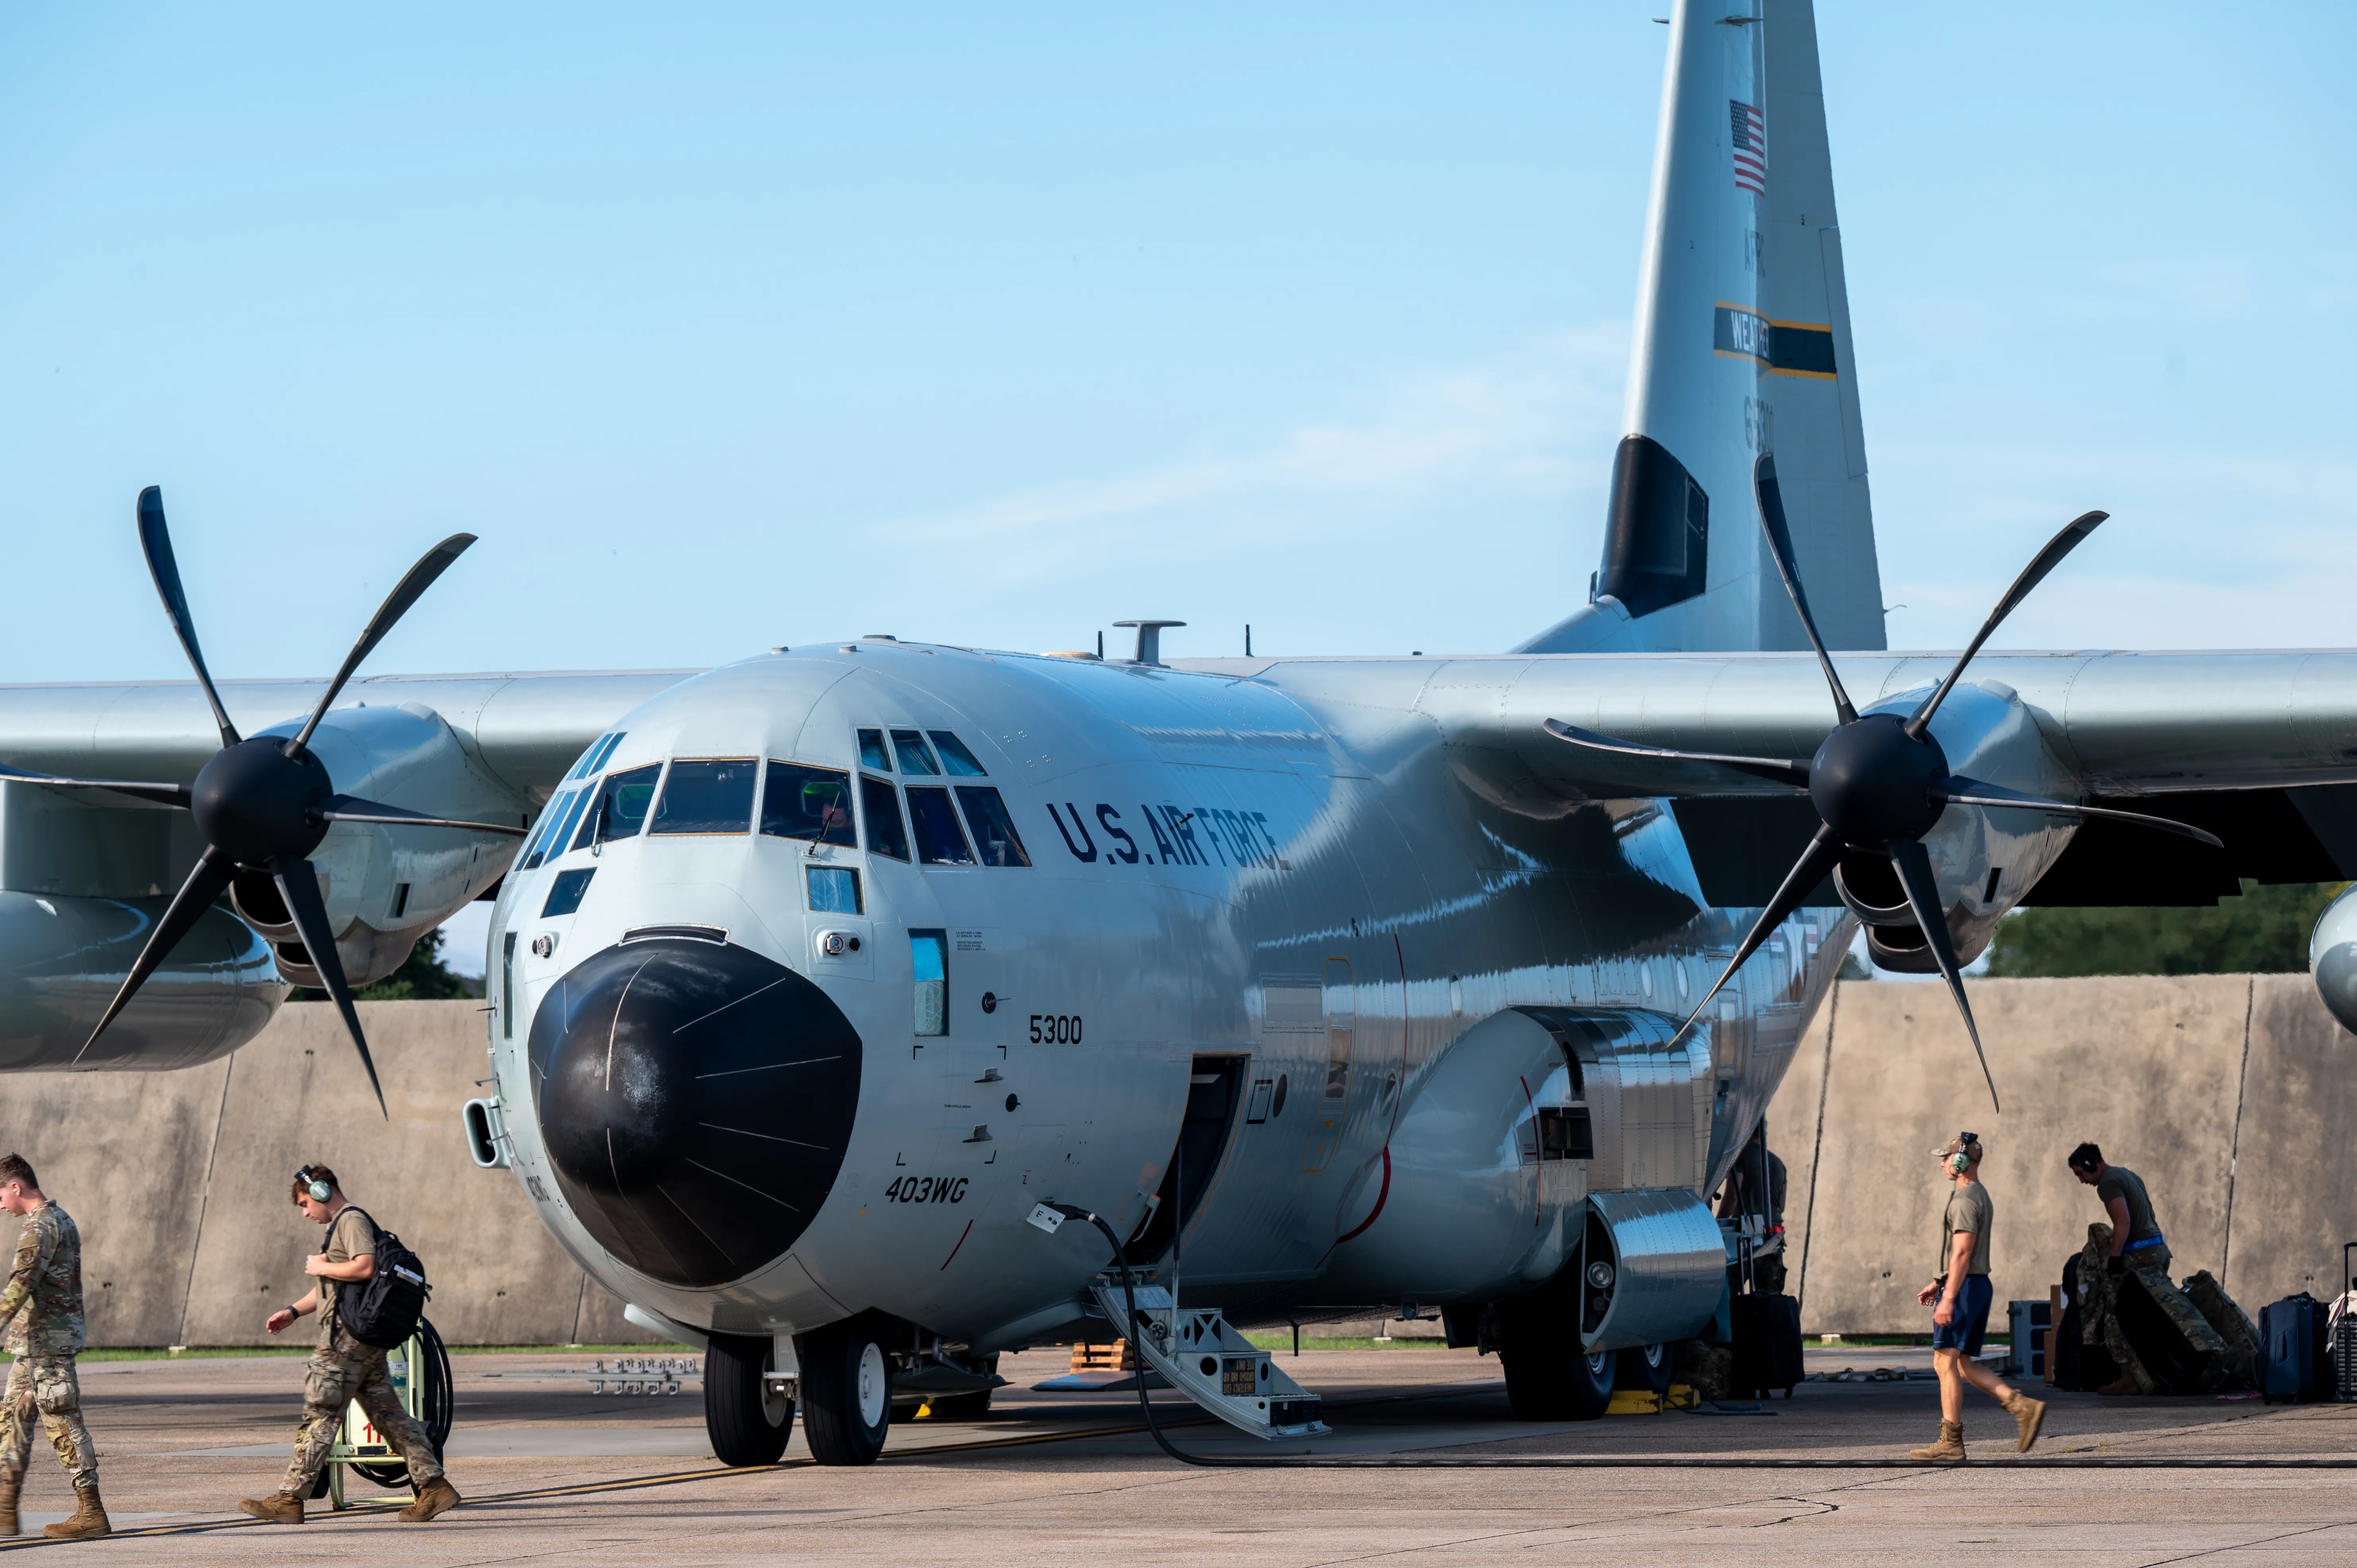
When a tropical cyclone threatens land, or when forecasters decide the satellite and model data just aren't enough, NHC issues a tasking order. It goes to one or both of two organizations. The 53rd Weather Reconnaissance Squadron of the U.S. Air Force Reserve, based at Keesler Air Force Base in Biloxi, Mississippi, handles the bulk of operational reconnaissance.2 Their flights are called fix missions, because the first job is to fix the storm's center, measure the central pressure, and pin down the maximum sustained winds. Those are the numbers that drive the official NHC advisory.
NOAA's Aircraft Operations Center, based at Lakeland Linder International Airport in Florida, flies a complementary fleet.3 NOAA P-3 Orion missions are often dual-purpose: operational data for NHC and research data for NOAA's Hurricane Research Division on the same flight. NOAA also flies the Gulfstream IV-SP, "Gonzo," on synoptic surveillance. Those high-altitude flights never touch the core; they sample the large-scale environment around the hurricane, and that data sharpens the track forecast by feeding the numerical models.
Mission duration depends on range, aircraft, pattern and weather. NOAA describes P-3 hurricane missions commonly lasting 8–10 hours. Briefings identify expected hazards, but cannot reveal every dangerous feature before takeoff.
Flight Patterns
Hurricane Hunters don't just fly in and circle. Each mission follows a precise, pre-defined pattern chosen to wring the most data out of the time available. The pattern sets how many times the aircraft crosses the center, at what angles, and which parts of the wind field get sampled.
Alpha Pattern
Operational center-crossing patterns sample different storm quadrants and obtain successive fixes. Leg lengths, headings and rotations are defined by the tasking and operations plan; 105 degrees is not a universal spacing between penetrations.
Figure-4 Pattern
Center-crossing flight patterns provide observations from different parts of a storm. Those measurements help characterize an asymmetric wind field rather than reducing the storm to a single maximum wind value.
Butterfly (Bowtie) Pattern
Research patterns can include butterfly patterns and targeted legs. The selected pattern determines the center crossings and areas sampled; a butterfly pattern should not be defined simply as avoiding the center.
Synoptic Surveillance (G-IV)
The G-IV samples the surrounding atmosphere at high altitude, commonly near 45,000 feet. The route is chosen for the mission, not a fixed 150–300-nautical-mile circle, and it avoids hazardous convection.
Flight Levels
Hurricane penetrations commonly occur near the 700-hPa level, roughly 10,000 feet. Other missions use different altitudes. A storm’s category alone does not set a safe altitude or a predictable eyewall transit time.
Inside the Eyewall
The eyewall is the ring of the strongest thunderstorms wrapped around the calm eye. It's the most violent part of the storm, where the highest winds, heaviest rain, and most extreme up- and downdrafts all concentrate. For a Hurricane Hunter crew, punching through it is the defining moment of every mission.
Eyewall turbulence can be severe. Crews use appropriate restraints and secure equipment; the load history of an encounter depends on conditions and aircraft response. Generic +3g to −1g values are not a standard mission specification.
And then, suddenly, the eye. The transition can be startlingly abrupt: in a matter of seconds the turbulence quits, the rain stops, and if the eye is well-formed the crew may see blue sky overhead by day or stars at night. The calm is a jarring contrast to the violence just crossed. Eye diameters run from about 5 miles (8 km) in the most intense, compact storms to over 40 miles (65 km) in larger ones. Wilma in 2005 holds the record for the smallest reliably measured Atlantic eye, just 2.3 miles (3.7 km) across at peak intensity, when it bottomed out at 882 millibars, the lowest pressure ever recorded in the Atlantic basin.4
Time in the eye isn't downtime. The crew releases an eye dropsonde, eyeballs the eye's structure, notes its diameter and shape, and records the character of the surrounding wall cloud. Those observations, joined to the instrument data, become the Vortex Data Message sent to NHC.
There's a myth worth puncturing here. The popular image of a Hurricane Hunter is white-knuckle daredevilry, a crew thrilling to the storm. The reality is closer to the opposite: disciplined, almost monotonous precision, the same pattern flown the same careful way a hundred times over, because the data is only worth anything if it's flown consistently. The professionalism is the point, not the adrenaline.
Dropsonde Deployment
Dropsondes profile pressure, temperature, humidity and wind along their descent. Models differ; current NCAR documentation describes the compact NRD41 and the larger RD41, rather than a single universal 300-g instrument.5
The parachute slows descent, with fall speed varying by altitude. Sensors measure thermodynamic variables, while GPS tracking supports the wind estimate. Sampling rates differ by variable; GPS does not itself measure pressure or temperature.5
Deployment counts vary by flight and season. Sondes may sample the eye, eyewall and environment as the mission requires; a single seasonal range should not be treated as a fixed combined NOAA/Air Force total.
An eye drop helps estimate central pressure but may miss the minimum. Category is based on maximum sustained surface wind, not pressure. Forecasters combine sonde, flight-level, SFMR and other observations.
Real-Time Data Transmission
Data from the aircraft reaches the National Hurricane Center by satellite in near-real time. The primary product is the Vortex Data Message, or VDM: a standardized report carrying the center location (latitude and longitude), the central pressure from the eye dropsonde, the maximum flight-level wind, the maximum surface wind from the Stepped Frequency Microwave Radiometer (SFMR), the eye's diameter and shape, the wall-cloud characteristics, and flight-level temperature, dew point, and pressure.
VDMs go out after each eyewall penetration, so NHC typically gets an updated center fix every one to two hours during an active mission. That cadence gives forecasters a nearly continuous read on the storm's intensity and how its structure is evolving.
High-density observations (HDOBs) and dropsonde reports are separate products. Data undergo transmission and quality control, and selected observations enter model assimilation systems. Available NHC products and archives are linked on its reconnaissance page.
Aircraft observations also have measurement limits. Instrument performance, rainfall, and storm structure affect interpretation; forecasters assess individual readings alongside other observations.
An Illustrative Mission Timeline
The sequence below is an illustrative schedule, not an operational standard. Tasking, transit and sampling times vary, and the example spans more than 24 hours from its initial tasking to landing.
- T−24 hours: NHC issues the tasking order through the NHOP framework, specifying the storm, the requested flight times, and the data products needed.
- T−12 hours: the assigned crew gets a detailed briefing covering the latest advisory, satellite imagery, model guidance, and expected turbulence.
- T−3 hours: pre-flight checks begin. Instruments are calibrated, dropsondes are loaded into the launch tubes, and the navigation and communication systems are verified.
- T−0: takeoff from Keesler Air Force Base, or a forward-deployed location like St. Croix or Bermuda.
- T+2 hours: the aircraft reaches the storm's periphery and begins its approach to the first penetration.
- T+2.5 hours: first eyewall penetration. The crew crosses the eyewall, enters the eye, deploys the eye dropsonde, and transmits the first VDM to NHC.
- T+3 to T+9 hours: repeated penetrations follow. A standard WC-130J mission produces 4 to 6 center fixes, each a complete pass through the eyewall, time in the eye, and an exit through the opposite wall.
- T+9 to T+10 hours: final penetration, final VDM, and the aircraft turns for home.
- T+11 hours: landing. The crew debriefs, reviews the data, and flags anything significant for the next crew in the rotation.
A mission supplies valuable observations along a limited set of flight paths. See the aircraft and instruments for how those measurements are collected.
Sources
-
National Hurricane Center. Aircraft Reconnaissance. NOAA. https://www.nhc.noaa.gov/abouthurraircraft.shtml ↩
-
National Hurricane Center. NHC Aircraft Reconnaissance. NOAA. "The ten Lockheed-Martin WC-130J aircraft and crews are part of the 403rd Wing, based at Keesler Air Force Base in Biloxi, Mississippi." https://www.nhc.noaa.gov/recon.php ↩
-
NOAA Aircraft Operations Center. https://www.omao.noaa.gov/aircraft-operations-center ↩
-
National Hurricane Center. Tropical Cyclone Reports. NOAA. https://www.nhc.noaa.gov/data/tcr/ ↩
-
NCAR dropsonde documentation. https://www.eol.ucar.edu/content/avaps-dropsondes ↩ ↩2