Hurricane reconnaissance aircraft carry some of the most specialized meteorological instruments ever built. Each one does a distinct job, and together they form an integrated observing system that measures a hurricane from the sea surface up through flight level and beyond. Their data feeds straight into the forecast models and the operational advisories at the National Hurricane Center. Strip these instruments away and intensity forecasting would fall back almost entirely on satellite estimation, which is valuable but can't match the precision of direct measurement. This article walks through each major instrument aboard a Hurricane Hunter: what it measures, how it works, and why it matters.
GPS Dropwindsonde (Dropsonde)
The GPS dropwindsonde is the single most important instrument in hurricane reconnaissance. It's a small, expendable sensor dropped from the aircraft into the storm, falling by parachute while it radios atmospheric measurements back to the plane. On the way down it builds a vertical profile of temperature, humidity, pressure, and wind from flight level to the sea. No other instrument delivers that combination, at that accuracy, inside a hurricane.
NCAR currently supports the NRD41, a smaller dropsonde electronically equivalent to the RD41. Its listed mass is 169 g, length 30.5 cm and diameter 4.5 cm. The RD94 was produced from 2009 to 2018, rather than being the 1997 model. Descent speed changes with altitude.1
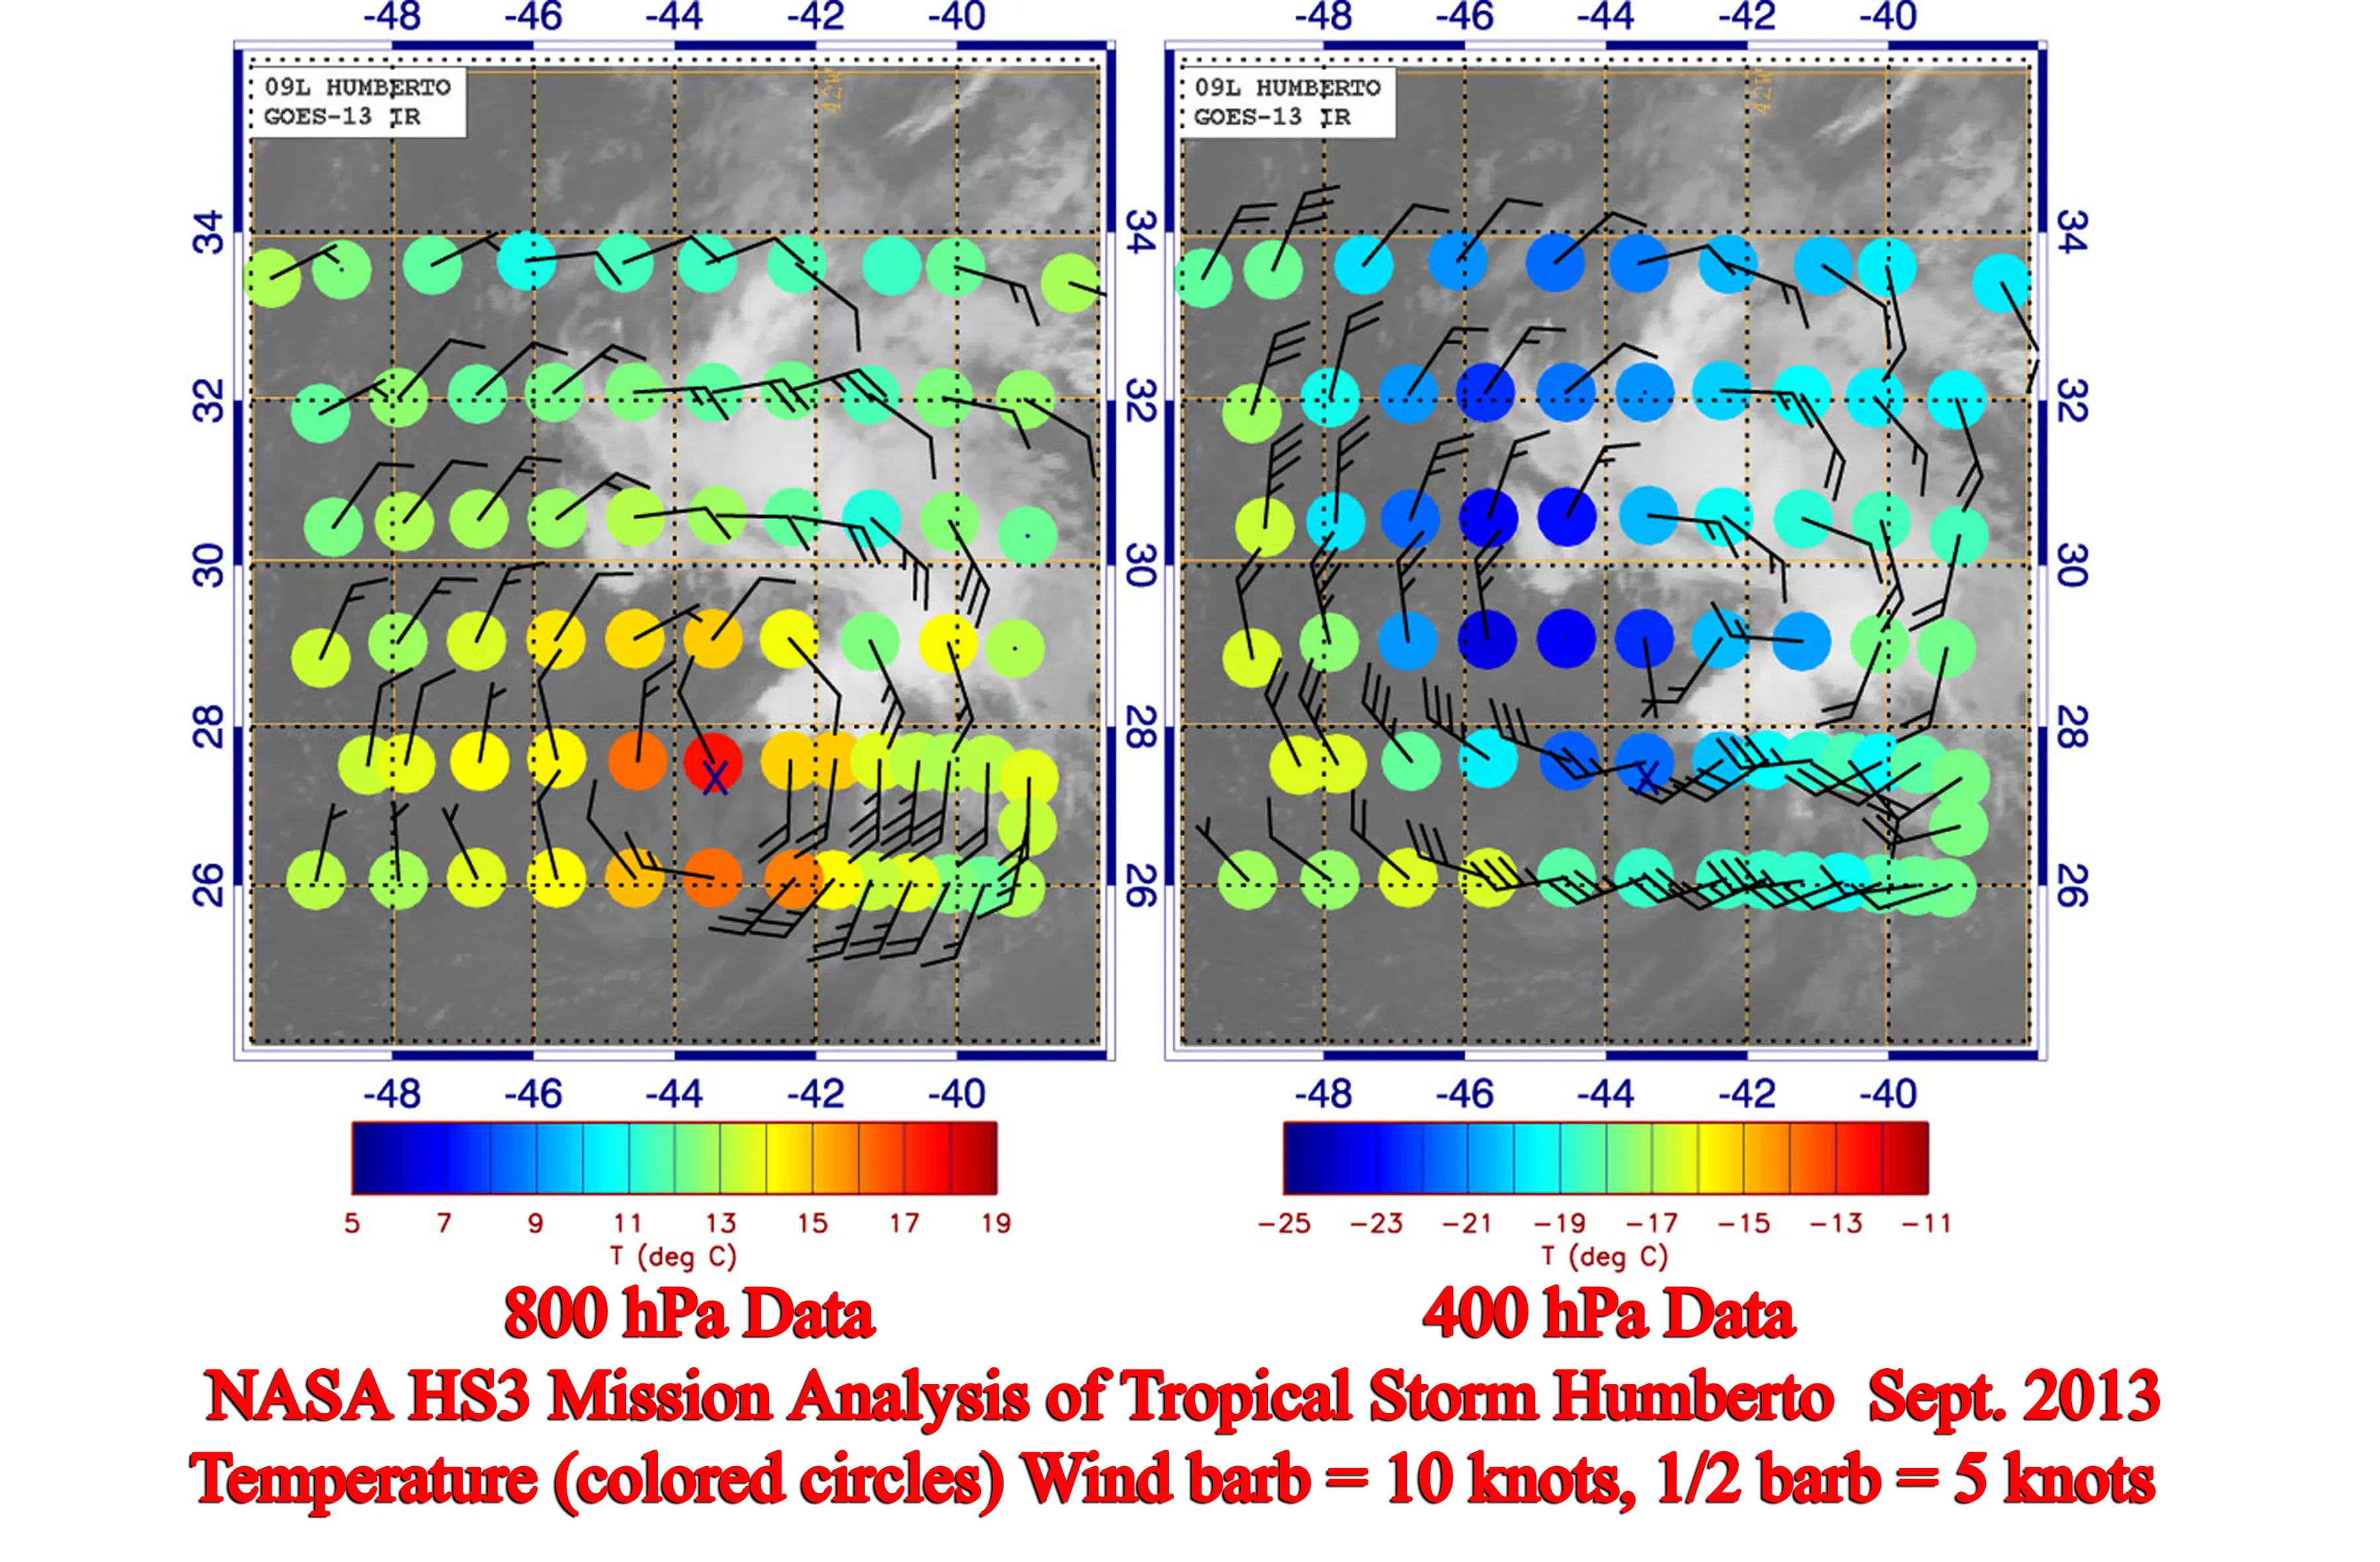
For the xRD41 family, NCAR lists uncertainties of ±0.5 hPa pressure, ±0.2°C temperature, ±3 percentage points relative humidity and ±0.5 m/s horizontal wind. GPS drift supplies the wind estimate. Sampling rates differ by variable: current documentation describes 2 Hz thermodynamic data and 4 Hz wind data.12
Eye drops help estimate central pressure, provided their path samples the relevant area. Pressure is an important structural measure, but Saffir–Simpson categories are based on maximum sustained surface wind, not a pressure reading alone.
Dropsondes complement remote observations with vertical profiles along their descent. Prices and annual deployment counts vary. Hock and Franklin (1999) document the earlier GPS system, not current procurement costs or RD41 specifications.3
Stepped Frequency Microwave Radiometer (SFMR)
The Stepped Frequency Microwave Radiometer, or SFMR, is a passive microwave sensor that reads surface wind speed and rain rate remotely from the aircraft. Where the dropsonde gives a single point, the SFMR gives a continuous along-track measurement of the surface wind as the aircraft flies. That continuity is what makes it invaluable for mapping the full radial wind profile on each pass through the eyewall.
The SFMR works at multiple frequencies in C-band, in the C-band of the microwave spectrum. Its principle is the link between ocean-surface roughness and microwave emission: wind whips up waves and foam, which raise the surface's emissivity. The SFMR measures the ocean's brightness temperature at each of its six frequencies and runs a retrieval algorithm to pull surface wind and rain rate out of them. The multiple frequencies let the algorithm separate the wind signal from the rain, since each affects brightness temperature differently across the band.
SFMR accuracy depends on conditions and the retrieval algorithm. Its continuous along-track sampling complements the more localized profiles from dropsondes; one universal ±4 m/s bound does not describe every retrieval.4
SFMR estimates wind over the ocean. Land contamination and near-coastal conditions can invalidate that retrieval, and rain effects require correction. This is a limitation of the retrieval assumptions, not the sensor literally ceasing to record.
Tail Doppler Radar (TDR)
The tail Doppler radar is an X-band (9.3 gigahertz) Doppler weather radar mounted in the tail of NOAA's WP-3D Orions. Unlike conventional radar, which measures only the intensity of the returned signal (reflectivity), the TDR also measures its Doppler shift, which reveals how fast the precipitation is moving relative to the radar. Combine that velocity with the radar's scanning geometry and you can reconstruct the three-dimensional wind field inside the hurricane.5
The TDR scans conically, alternating fore and aft sweeps as the aircraft flies through the storm. Those two sweeps give two viewing angles on the same volume of air as the plane moves forward, and by combining the radial velocities from both, researchers produce a pseudo-dual-Doppler analysis that resolves the full 3-D wind field, the same idea as ground-based dual-Doppler radar, pulled off with a single radar on a moving platform.
The effective resolution of a Doppler wind analysis depends on radar sampling and processing. These analyses reveal eyewall and rainband structure, but do not resolve every mesovortex or fine boundary-layer roll. Quoted ranges and grid sizes must be tied to a specific system or analysis.5
Lower Fuselage (LF) Radar
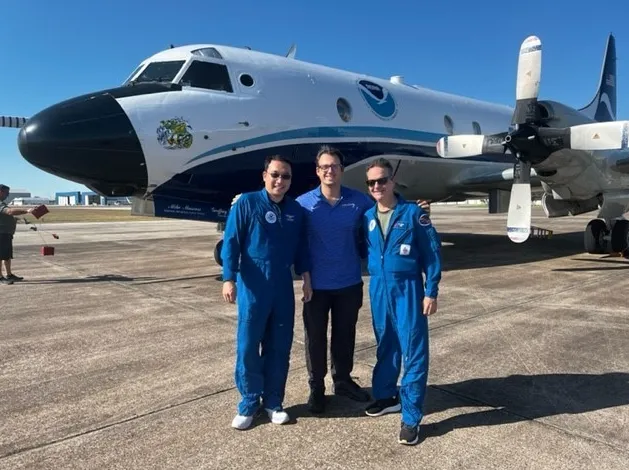
The lower fuselage radar is a C-band (5.37 gigahertz) weather radar mounted on the belly of the NOAA P-3. It sweeps a full 360 degrees, working much like a ground-based weather radar but from 10,000 feet (3,000 m) or higher. From up there it gets an unobstructed view of the hurricane's precipitation out to about 200 nautical miles (370 kilometers).
The LF radar maps the storm's precipitation architecture in real time: the concentric rings of the eyewall, the spiral rainbands reaching outward, the relatively clear eye, and the asymmetries that carry structural clues. Crews also use it to navigate, picking the safest path through the eyewall and steering around the worst convective cores when they can.
Beyond navigation, the LF radar is a scientific instrument. Its composites go to the National Hurricane Center in real time, where forecasters read them to assess structure, watch eyewall replacement cycles, and gauge how symmetric the storm is. A symmetric presentation with a well-defined eye describes organization, but does not establish steady intensity; asymmetry or a ragged eyewall can flag weakening or structural change. LF radar for the big-picture structure and TDR for the three-dimensional winds together give the P-3 a radar capability no other platform matches.
Flight-Level Instruments
Alongside the specialized remote sensors, Hurricane Hunters carry a suite of standard meteorological instruments that log conditions at flight level throughout the mission. These provide the continuous, high-resolution record that complements the dropsonde profiles and the remote-sensing data.
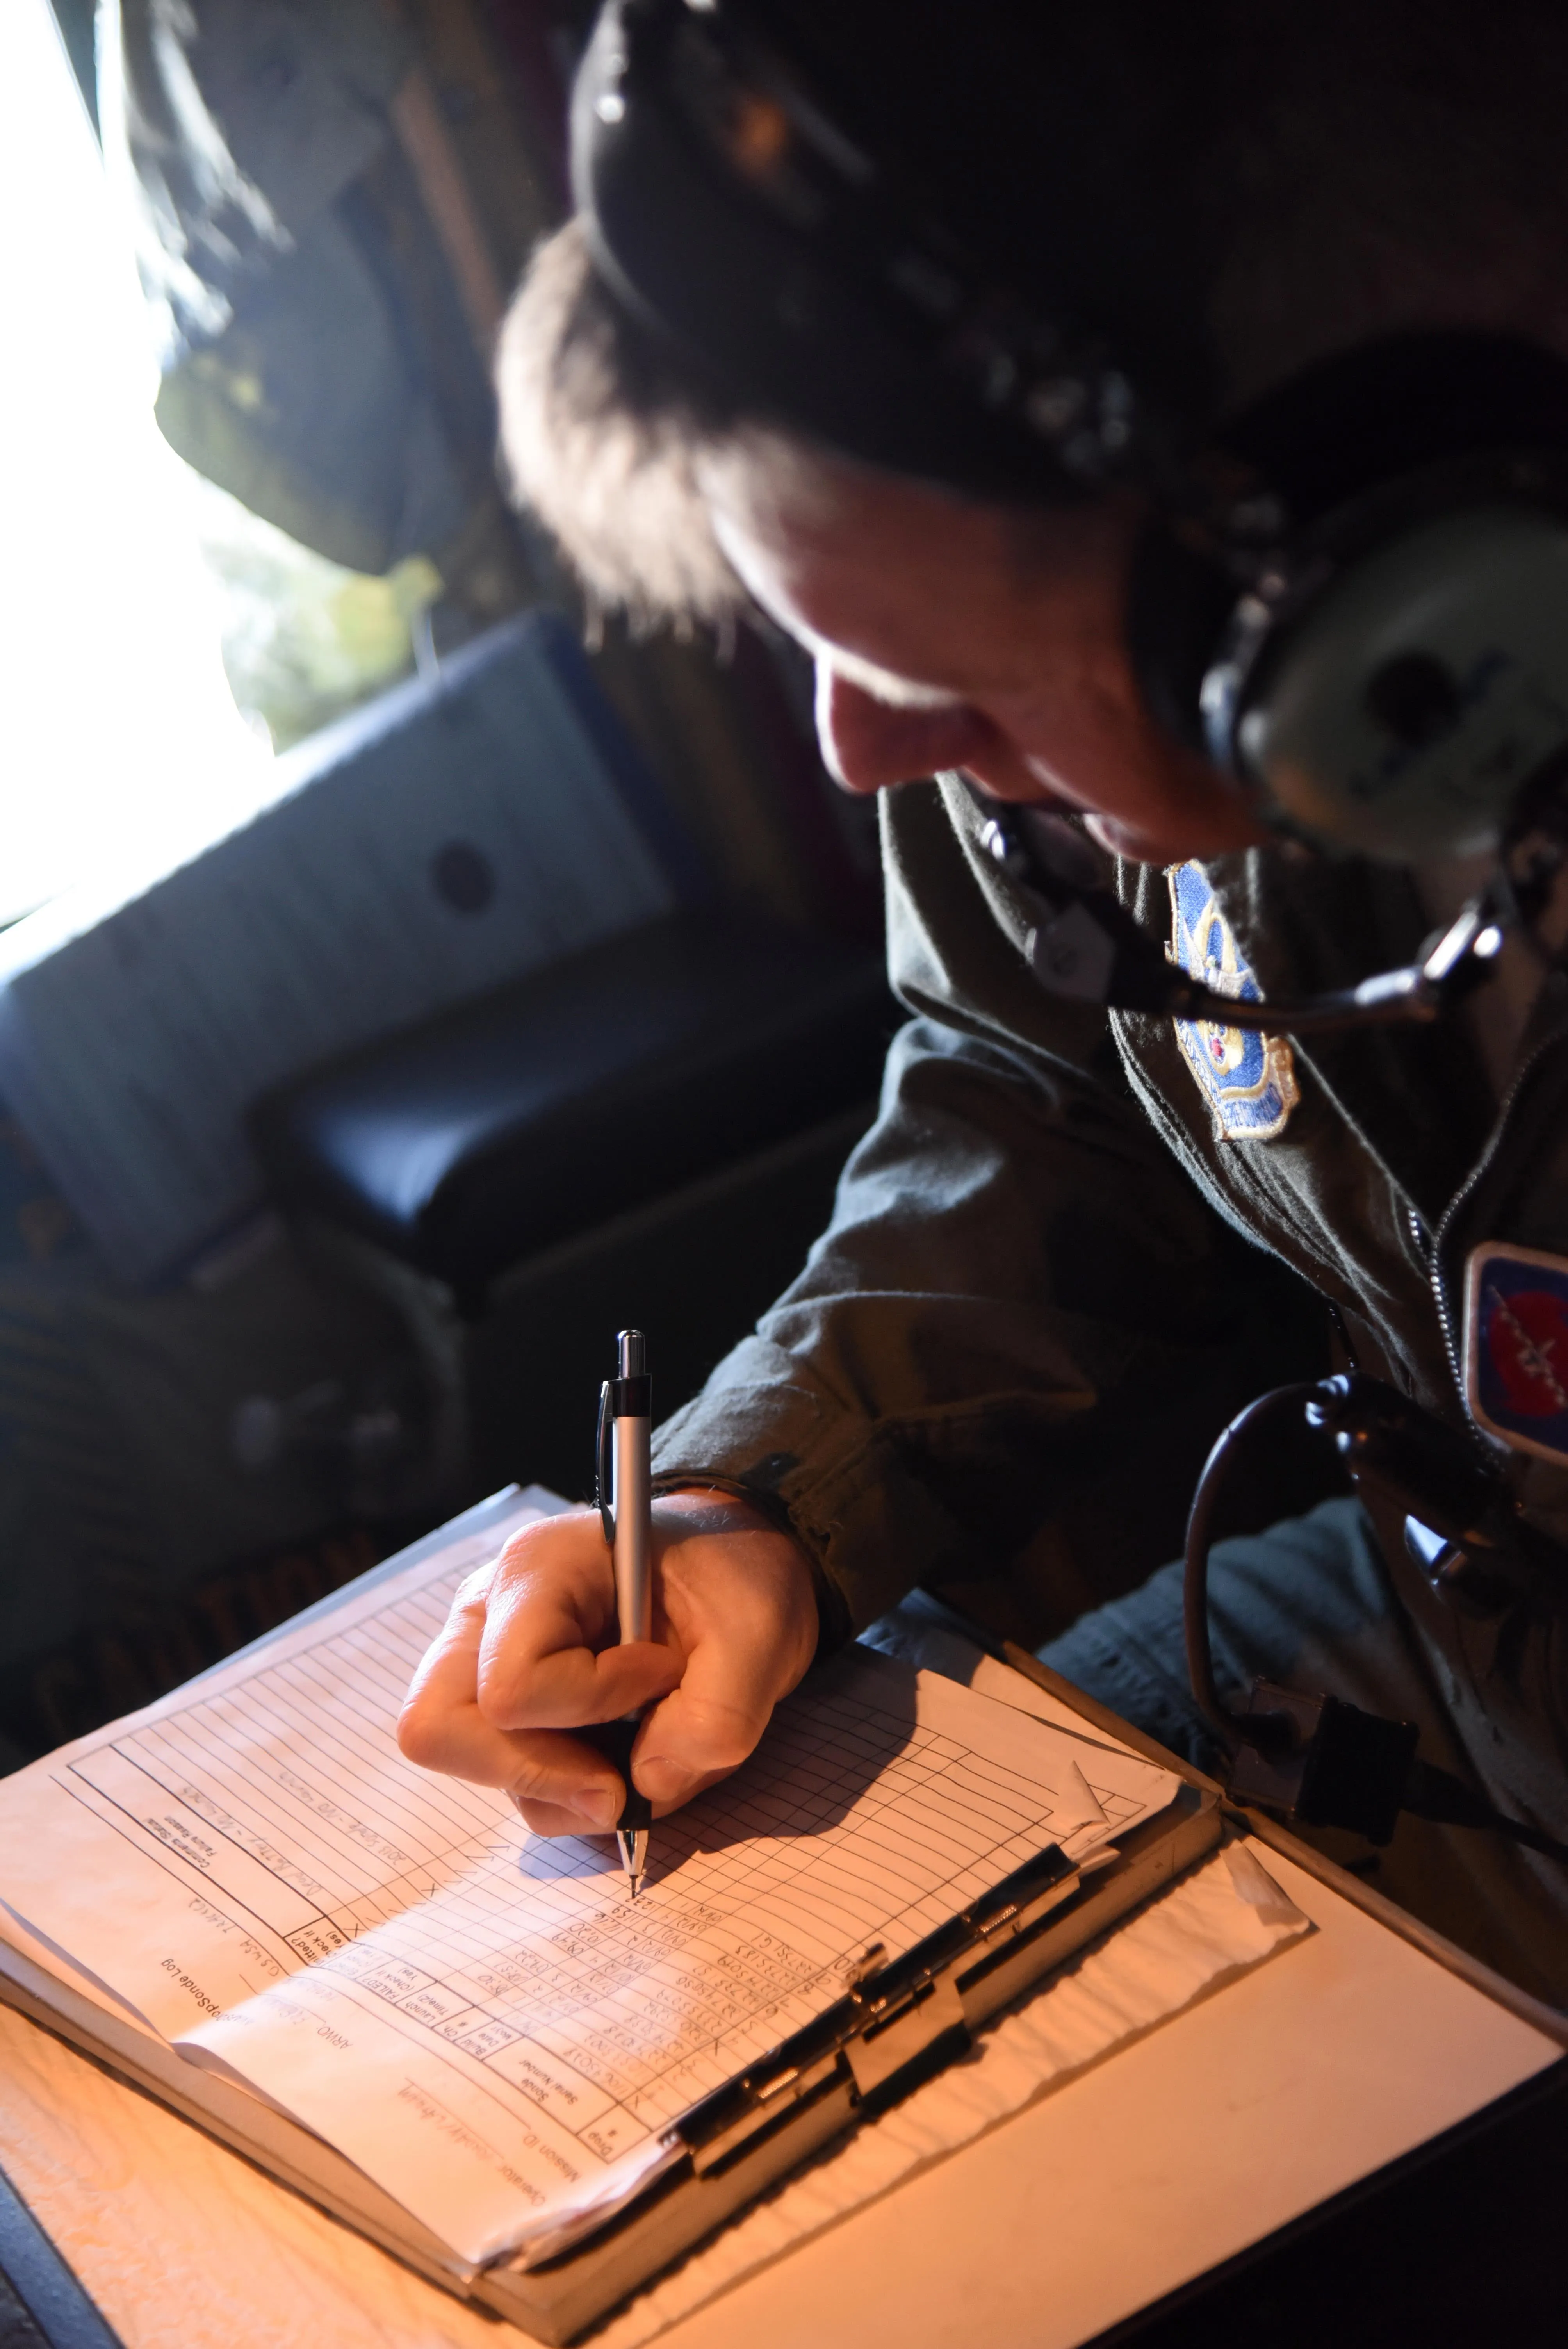
Flight-level systems measure position, air motion, pressure, temperature and moisture. Deriving wind requires the aircraft’s ground-motion vector, orientation and air-motion measurements; a scalar pitot airspeed alone is insufficient.
Sampling and archived output rates vary by instrument and product. The measurements form time series along the flight path; it is incorrect to assign every instrument a single 1 Hz recording rate.
A commonly used estimate relates the maximum 700-hPa wind to a surface value near 90% of it. This is not a universal conversion for each measurement or altitude.6
Flight-level winds are not surface winds. The commonly used 700-hPa reduction is an empirical estimate and varies with storm structure and sampling; SFMR and dropsondes help constrain the surface analysis.6
Emerging Technologies
The instrument suite keeps evolving. A handful of emerging technologies promise to widen the range and sharpen the resolution of in-situ hurricane observations in the years ahead.
Coyote Uncrewed Aircraft System (UAS)
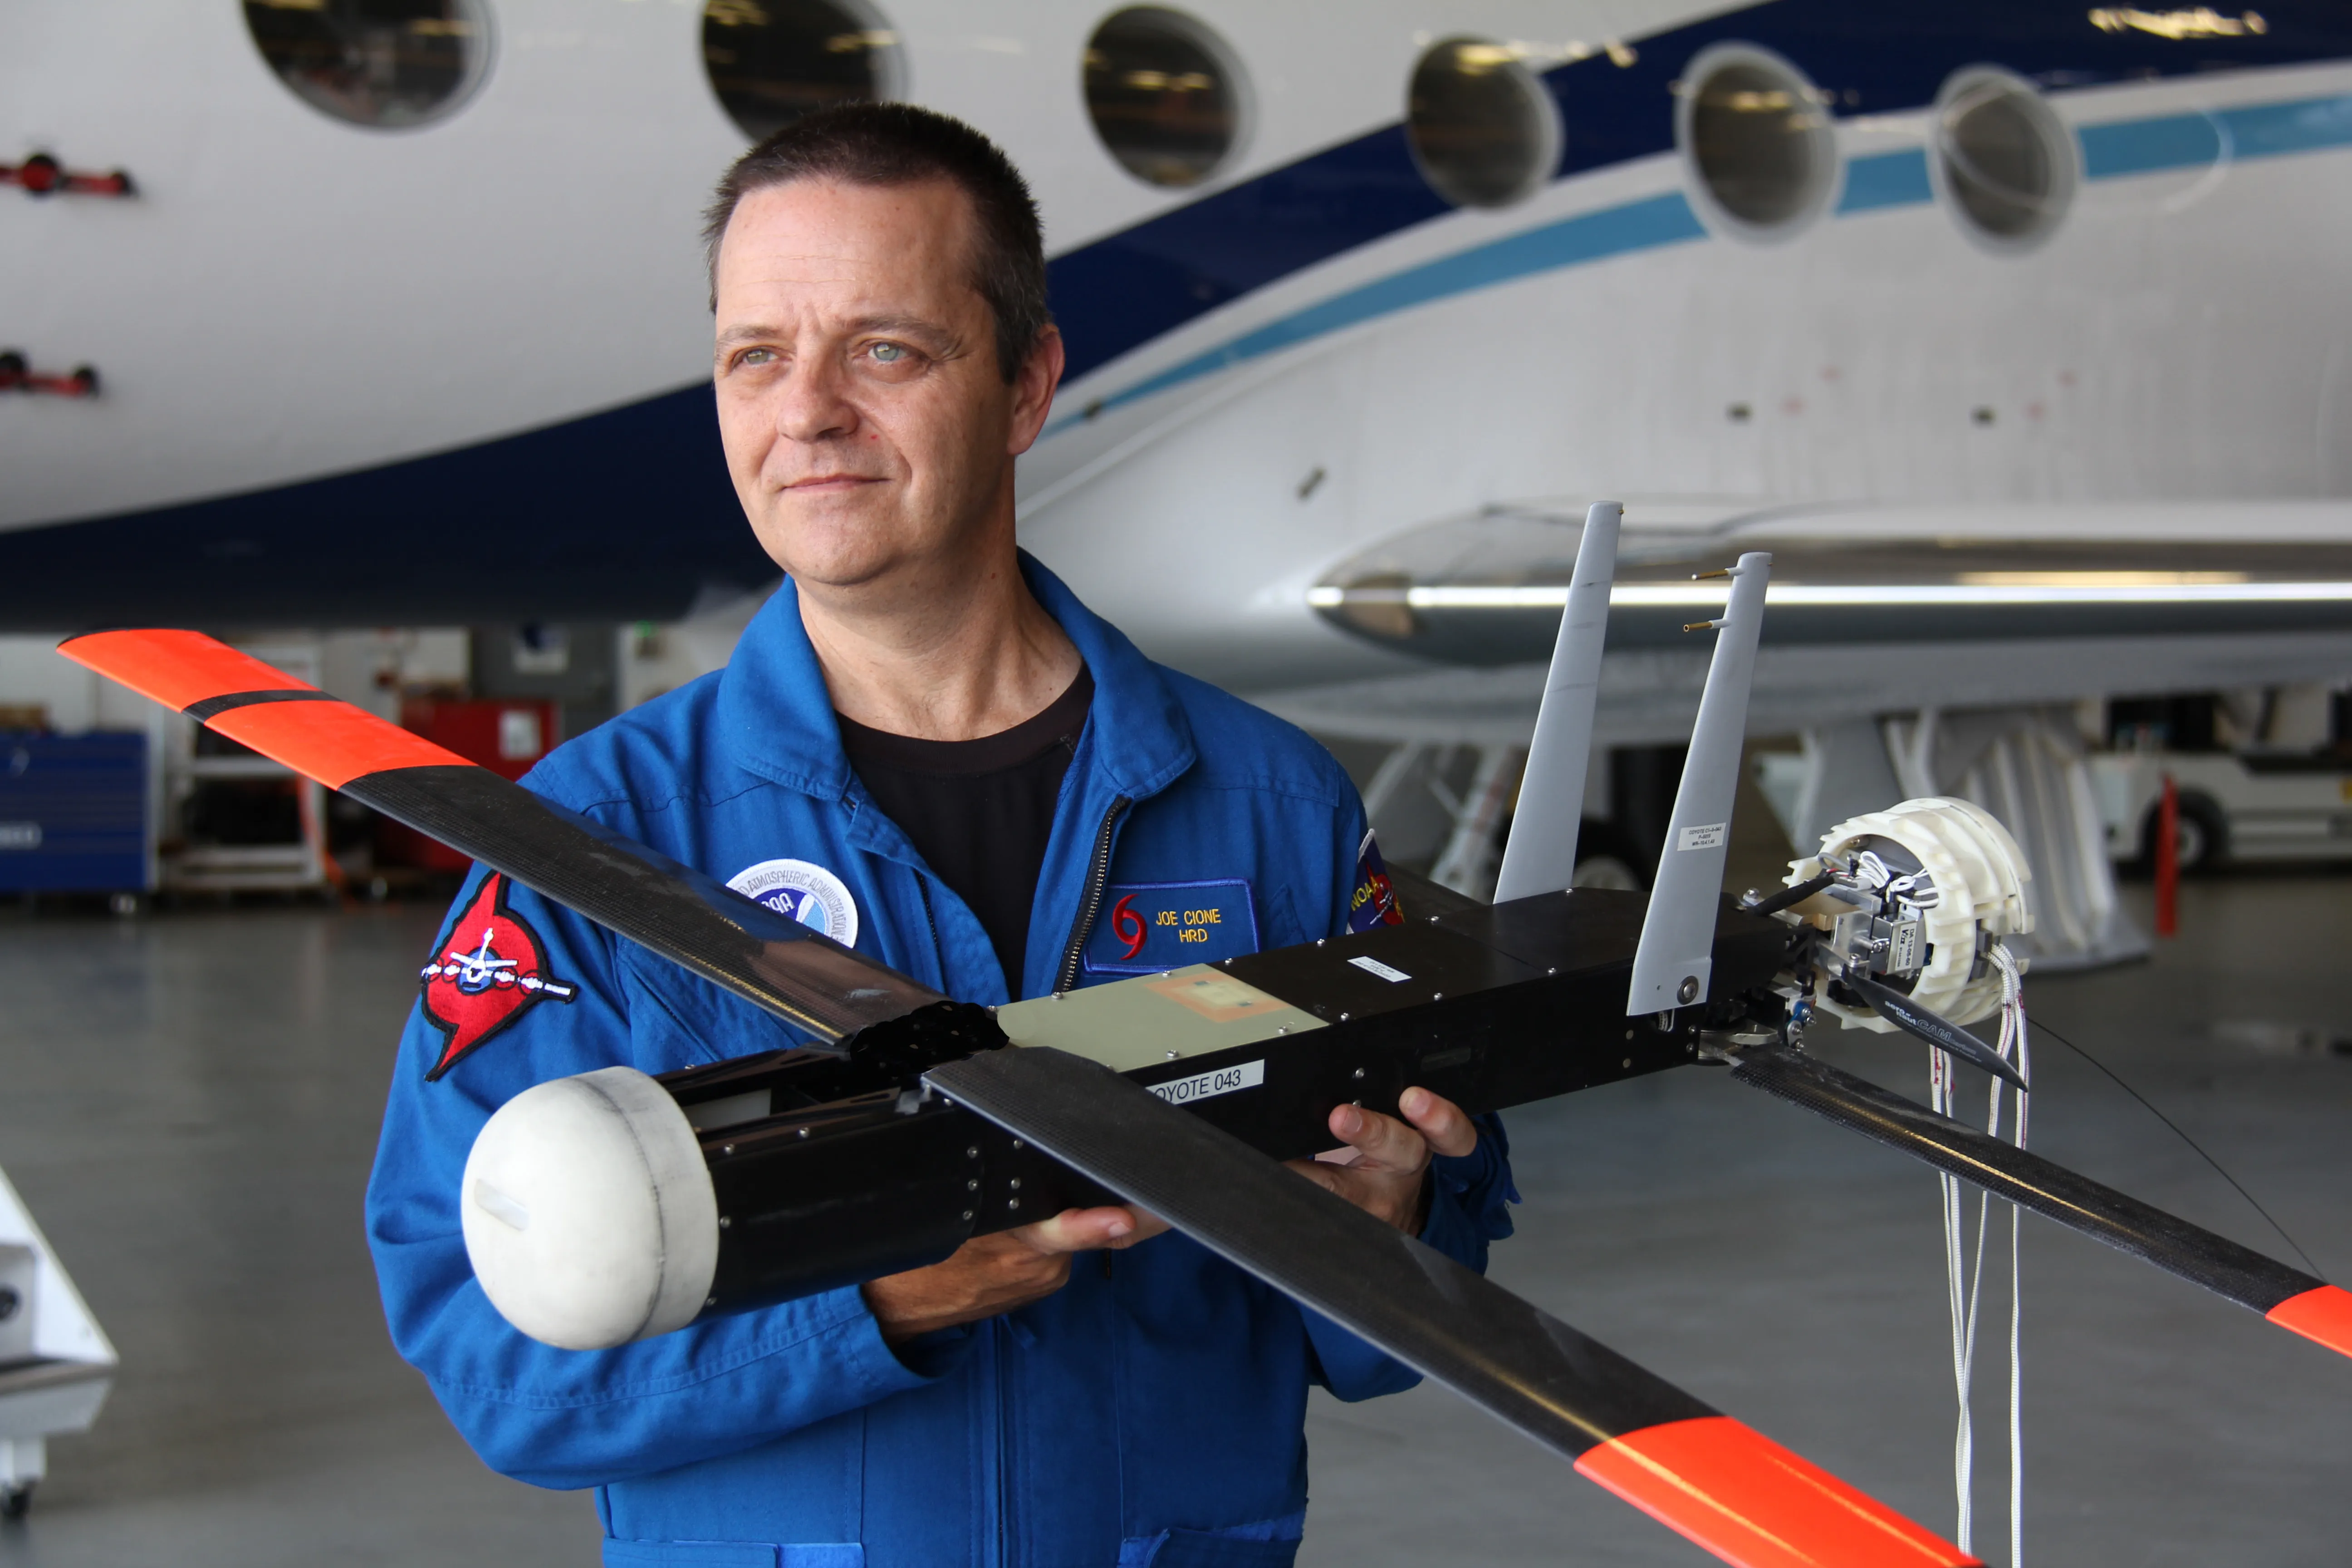
The Coyote is a small expendable drone launched from a P-3 through a standard sonobuoy tube. With a wingspan of about 4.9 feet (1.5 meters) and a weight near 13 pounds (6 kilograms), it's built to fly between 200 and 1,500 feet (61 and 460 meters) in the hurricane boundary layer, a region too dangerous for crewed aircraft. It carries temperature, pressure, humidity, and wind sensors, streaming data back to the P-3 in real time. Its first hurricane research deployment came during Hurricane Edouard in 2014.7 Developed by Raytheon (now RTX), the Coyote is a major step toward routinely sampling the lowest levels of the storm, where the most destructive winds live. Cione et al. (2016) describe the system and its early deployments.
LIDAR
Light Detection and Ranging (LIDAR) instruments are being explored for hurricane work to measure aerosol structure and vertical wind profiles. Airborne LIDAR can reach into clear-air regions that radar can't see, filling in the wind-field picture in the eye and the outer storm where precipitation is sparse.
Advanced Scatterometry
Satellite scatterometers, such as the Advanced Scatterometer (ASCAT) on the MetOp satellites, measure surface wind over the ocean. They complement aircraft by covering the broad outer wind field, but they can't replace aircraft in the inner core, where the highest winds and fastest changes are. Today's scatterometers simply don't have the resolution or sampling frequency to resolve the tight wind gradients near the eyewall.
Improved Dropsondes
Next-generation dropsondes aim to be smaller, lighter, and cheaper. Multi-launcher systems are in development that can fire rapid "curtain" deployments of many sondes at once, cutting dense vertical cross-sections through the eyewall or boundary layer, and resolving the sharp gradients at the eyewall boundary at a resolution we've never had.
AI-Assisted Analysis
Automated analysis is a research direction for quality control and feature identification. Specific claims about operational AI mission planning need a documented system and validation. See future observing systems.
Sources
-
NCAR dropsonde specifications. https://www.eol.ucar.edu/content/avaps-dropsondes ↩ ↩2
-
NCAR, What is a dropsonde?. https://www.eol.ucar.edu/our-services/education-outreach/what-dropsonde ↩
-
Hock, T. F., & Franklin, J. L. (1999). The NCAR GPS dropwindsonde. Bulletin of the American Meteorological Society, 80(3), 407–420. https://doi.org/10.1175/1520-0477(1999)080%3C0407:TNGD%3E2.0.CO;2 ↩
-
Uhlhorn, E. W., & Black, P. G. (2003). Verification of remotely sensed sea surface winds in hurricanes. Journal of Atmospheric and Oceanic Technology, 20(1), 99–116. https://doi.org/10.1175/1520-0426(2003)020%3C0099:VORSSS%3E2.0.CO;2 ↩
-
Gamache, J. F., Marks, F. D., & Roux, F. (1995). Comparison of three airborne Doppler sampling techniques with airborne in situ wind observations in Hurricane Gustav (1990). Journal of Atmospheric and Oceanic Technology, 12(1), 171–181. https://doi.org/10.1175/1520-0426(1995)012%3C0171:COTADS%3E2.0.CO;2 ↩ ↩2
-
Franklin, J. L., Black, M. L., & Valde, K. (2003). GPS dropwindsonde wind profiles in hurricanes and their operational implications. Weather and Forecasting, 18(1), 32–44. https://doi.org/10.1175/1520-0434(2003)018%3C0032:GDWPIH%3E2.0.CO;2 ↩ ↩2
-
Cione, J. J., Kalina, E. A., Uhlhorn, E. W., Farber, A. M., & Damiano, B. (2016). Coyote unmanned aircraft system observations in Hurricane Edouard (2014). Earth and Space Science, 3(9), 370–380. https://doi.org/10.1002/2016EA000187 ↩