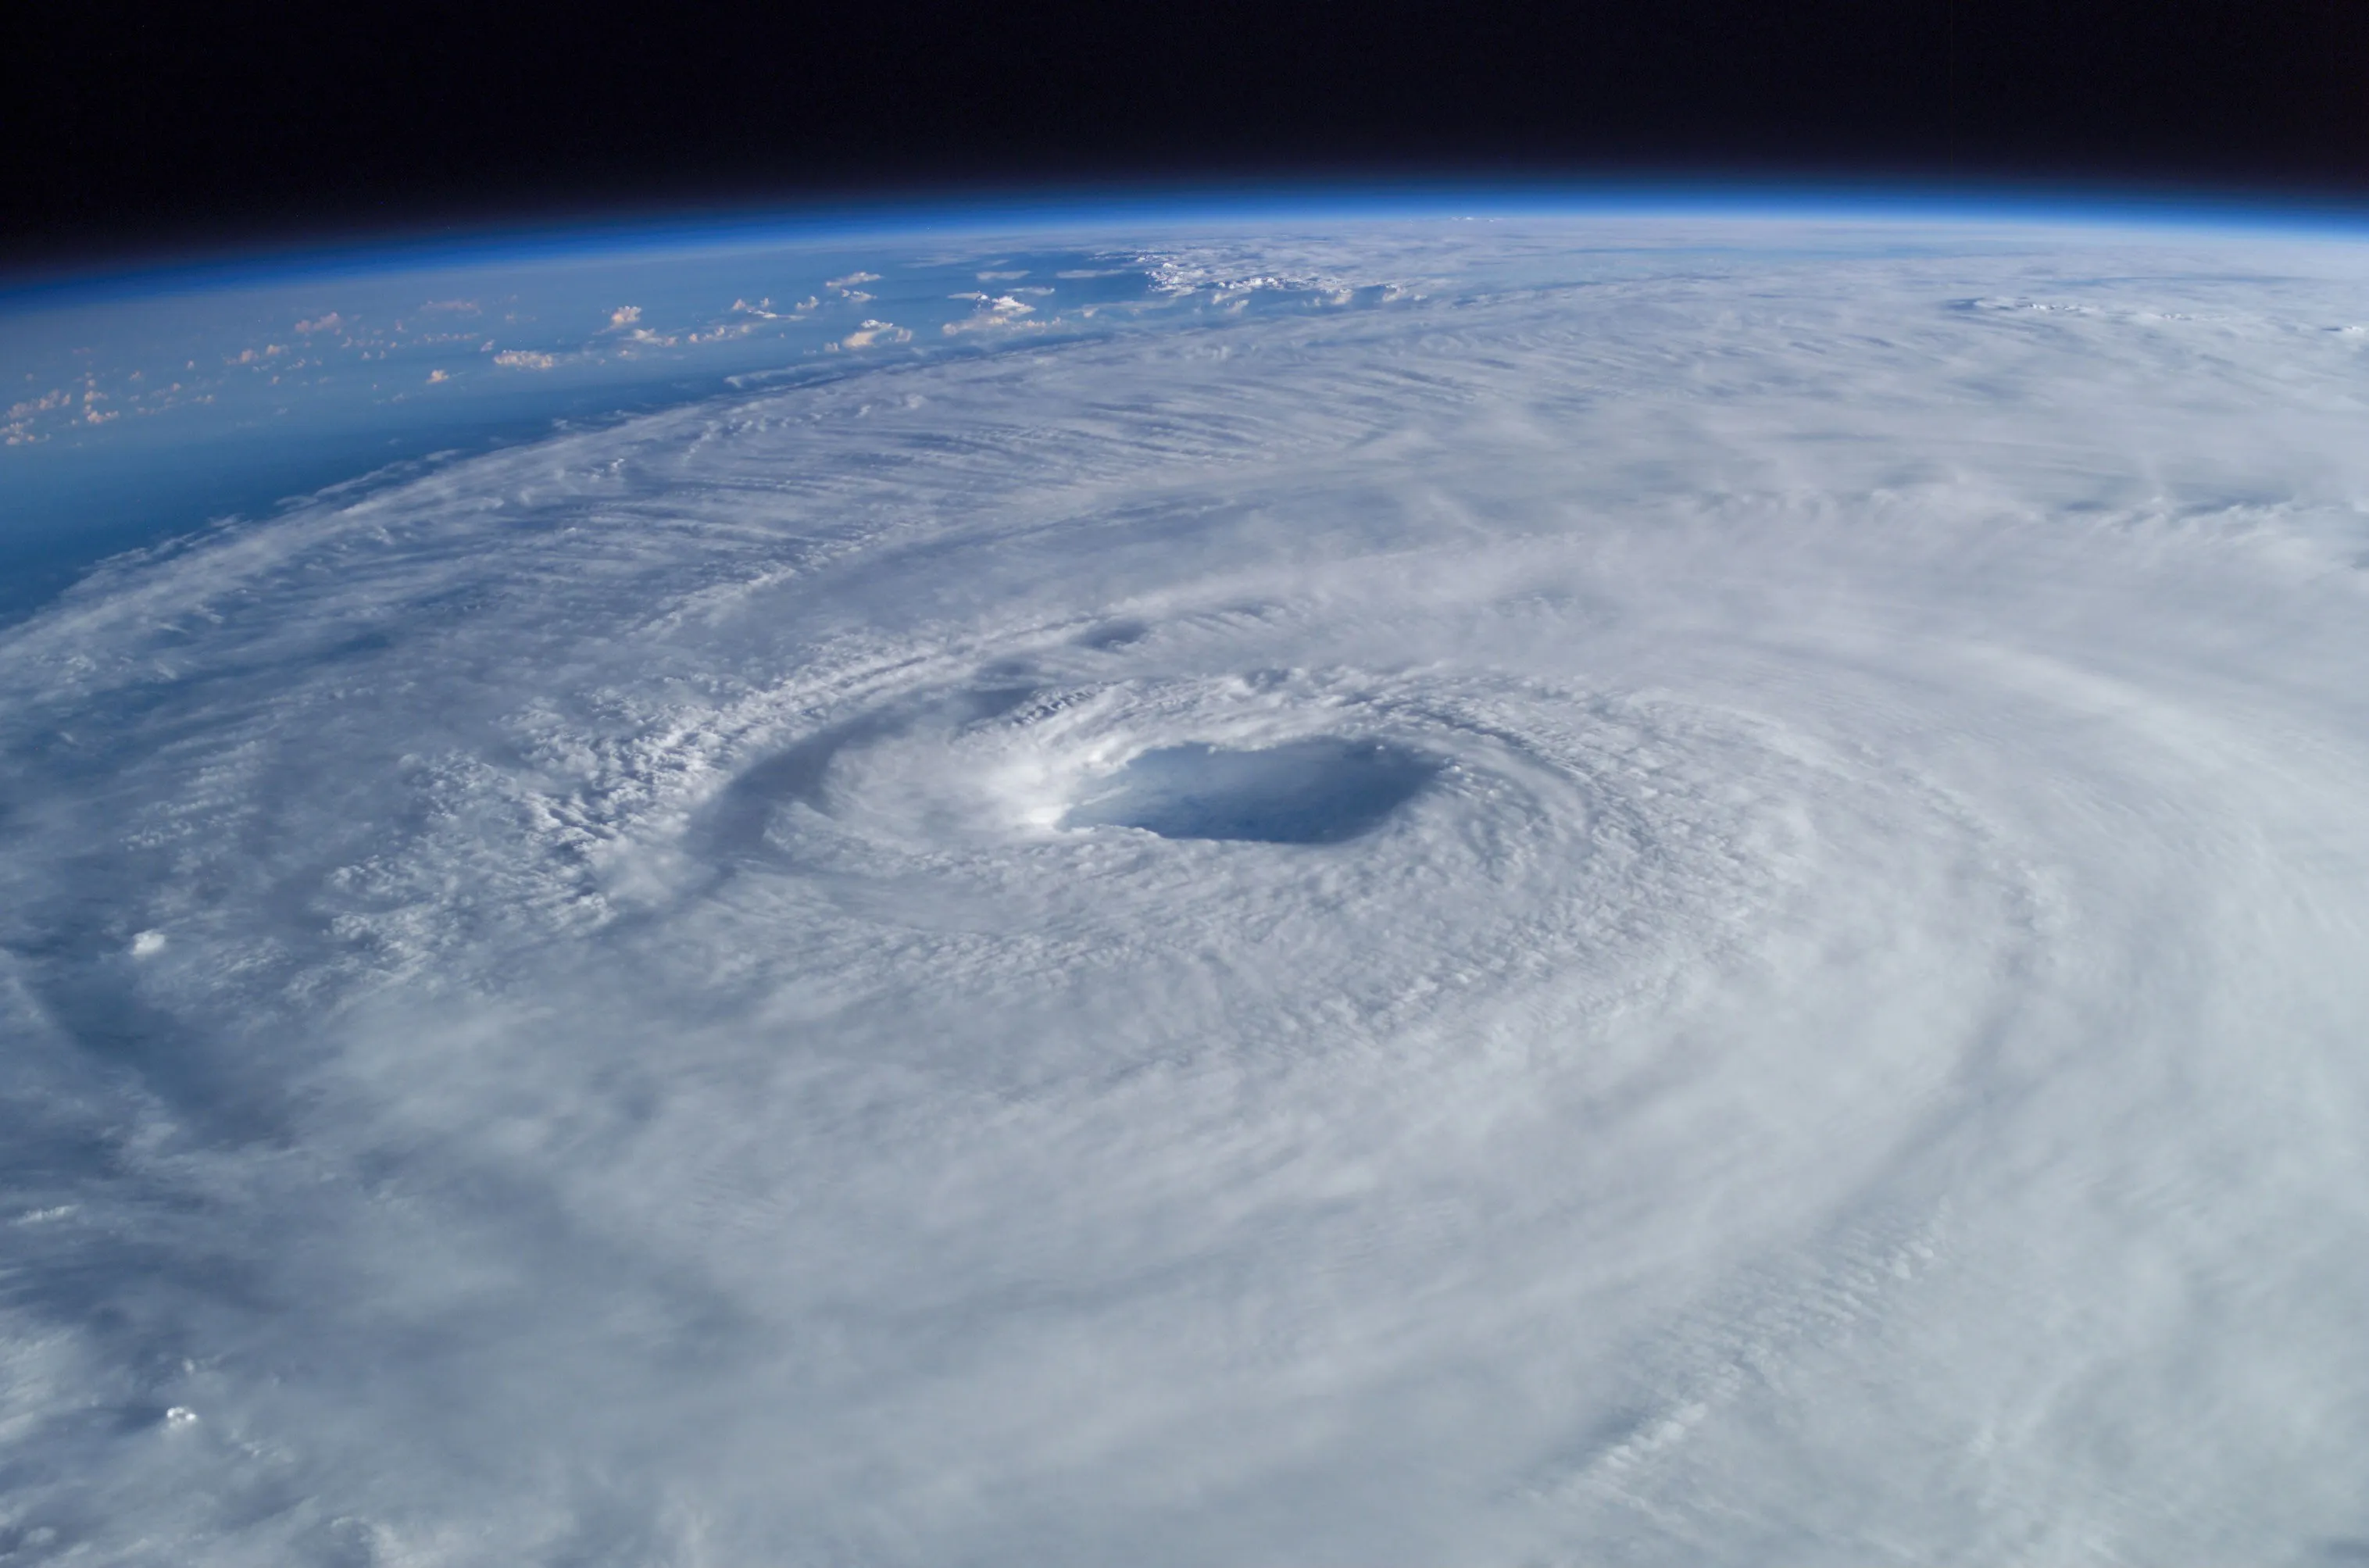
Every year between June and November, warm Atlantic waters fuel powerful storms that can reshape coastlines, flood cities, and test the limits of modern forecasting. Understanding how a hurricane works is practical knowledge for anyone who lives near a coast, works in emergency management, or simply wants to make sense of the weather that dominates the news each fall.
This guide covers the basic physics of hurricane formation, the Saffir-Simpson scale, the anatomy of a storm, the forces that steer it, and how forecasters track it. It is the place to start whether you want the fundamentals or a closer look at why some storms explode in strength overnight.
What Is a Hurricane?
A hurricane is a large rotating storm system that forms over warm tropical or subtropical ocean water. It is characterized by a low-pressure center, strong winds of at least 74 mph (119 km/h), and organized thunderstorm activity that spirals inward toward the core.1
The term "hurricane" is specific to the Atlantic Ocean and the eastern and central North Pacific. The same type of storm is called a typhoon in the western Pacific and a cyclone in the Indian Ocean and near Australia. Scientifically, all three are classified as tropical cyclones. The physics are identical. Only the name and the ocean basin differ.
Tropical cyclones are heat engines. They extract energy from warm ocean water through evaporation, convert that moisture into towering thunderstorms, and release enormous quantities of latent heat in the process. That released heat warms the air inside the storm, lowers the central pressure further, and draws in more wind at the surface. The cycle feeds itself for as long as conditions remain favorable.
Condensation in a hurricane releases enormous amounts of heat. Comparisons with global electricity production depend on the assumed storm and reference year; they should not be treated as a measured output for every hurricane.
How Hurricanes Form
Hurricane formation, or tropical cyclogenesis, is favored by warm water, moisture, weak vertical shear, and a pre-existing circulation. These are guidelines rather than a list of absolute cutoffs.
Sea Surface Temperature
Warm surface water around 80°F (26.5°C) or higher, with warmth extending beneath the surface, commonly favors development. The atmospheric temperature profile also matters. Deep warm water limits how much cooler water a storm can mix to the surface.
Atmospheric Moisture and Instability
High humidity in the lower and middle levels of the atmosphere, roughly from the surface up to about 16,000 feet (5 km), is essential. Dry air at mid-levels can choke developing thunderstorms by promoting downdrafts that disrupt the circulation before it can organize. The Saharan Air Layer, a mass of very dry, dusty air that streams off North Africa during summer, is one of the most effective natural suppressors of hurricane development in the Atlantic. When a tropical wave encounters the SAL, it often struggles to maintain the deep convection it needs to organize.
Low Wind Shear
Vertical wind shear changes wind speed or direction with height. Strong shear can displace thunderstorms from the low-level center and hinder development, but no single shear threshold determines the outcome for every storm.
Distance from the Equator
Formation is uncommon within about five degrees of the equator because planetary rotation supplies less background spin there. This is not an absolute latitude boundary; rare near-equatorial tropical cyclones have occurred.
A Pre-Existing Disturbance
Hurricanes do not form out of nothing. They need a starting point: a cluster of thunderstorms, a tropical wave rolling off the African coast, or a decaying frontal boundary. These seed disturbances provide the initial low-level spin and convergence that the other ingredients can amplify.
In the Atlantic, most hurricanes trace their origins to tropical waves that move westward off the coast of West Africa between June and November.
The Hurricane Lifecycle
Tropical-cyclone classifications describe observed strength and structure. They are not a required sequence: some systems weaken before becoming hurricanes, and storms can transition to other types.
Tropical Disturbance
The lifecycle begins with a disorganized cluster of thunderstorms over warm water, often spawned by a tropical wave. At this stage there is no closed circulation and no defined center. Most tropical disturbances never develop further.
Tropical Depression
When the thunderstorms organize enough to produce a closed low-level circulation with maximum sustained winds below 39 mph (34 knots), the system is classified as a tropical depression. It receives a number but not yet a name.
Tropical Storm
If the depression continues to strengthen and sustained winds reach 39 mph (63 km/h), it becomes a tropical storm and receives an official name from a pre-determined list maintained by the World Meteorological Organization. Spiral rainbands become more defined and the overall structure tightens. At this stage, the storm begins to show the characteristic comma or spiral shape on satellite imagery.
Hurricane
At 74 mph (119 km/h), the storm becomes a hurricane. By this point, the system typically has a well-defined eye, a compact eyewall of intense thunderstorms, and a large shield of spiral rainbands extending hundreds of miles from the center.
Dissipation
Hurricanes weaken when they lose access to their fuel. The most common causes are landfall, where friction and the absence of warm water rapidly drain energy from the storm; movement over cooler ocean water below 79°F (26°C); and increasing wind shear that disrupts the circulation. Some hurricanes undergo extratropical transition, merging with mid-latitude weather systems. They lose their tropical characteristics but can remain dangerous, producing heavy rain and strong winds over a wide area.
Anatomy of a Hurricane
A mature hurricane is one of the most organized structures in the atmosphere. Each part of the storm plays a specific role in maintaining and distributing its energy.
The Eye
The eye is the calm center of the hurricane, a roughly circular area of sinking air where skies are often clear or partly cloudy and winds are light, usually under 15 mph (24 km/h). A typical eye measures 20 to 40 miles (32 to 64 km) across, with substantial variation between storms. Smaller, more sharply defined eyes are generally found in stronger hurricanes.
The Eyewall
Surrounding the eye is the eyewall, a dense ring of the tallest and most violent thunderstorms in the system. This is where the strongest winds and heaviest rainfall occur. The strongest wind can occur above the surface, with its height varying by storm and position. The eyewall is also where the tightest pressure gradient exists, meaning pressure drops most rapidly as you move inward.
Rainbands
Spiraling outward from the eyewall are curved bands of thunderstorms called rainbands. These bands can extend hundreds of miles from the center and are responsible for much of the rainfall and embedded tornadoes associated with landfalling hurricanes. Between the bands, the weather can be deceptively calm.
Upper-Level Outflow
At the top of the storm, roughly 40,000 to 50,000 feet (12,000 to 15,000 m) up, air that has risen through the eyewall and rainbands flows outward in all directions. This outflow is visible on satellite imagery as the broad cirrus canopy that gives hurricanes their characteristic disk-like appearance. Efficient outflow is essential. If the upper-level exhaust is blocked, the heat engine stalls.
The Warm Core
Unlike mid-latitude storms, which are powered by temperature contrasts between air masses, a hurricane is a warm-core system. The center of the storm is warmer than the surrounding environment through a substantial depth of the troposphere. This warmth is produced by the release of latent heat as water vapor condenses into clouds and rain. The warm core lowers the surface pressure, which in turn drives the inflow of air and sustains the wind circulation. When a hurricane undergoes extratropical transition and its warm core is replaced by frontal temperature contrasts, it loses its tropical identity even if strong winds persist.
Overall Size
A storm’s size depends on the chosen measure, such as the radius of tropical-storm-force winds. Sandy (2012) had an exceptionally broad wind field, but cloud-shield width and wind-field width are not interchangeable. Category alone does not describe size.
The Saffir-Simpson Hurricane Wind Scale
The Saffir-Simpson scale classifies hurricanes by maximum sustained surface wind. Its wind-only version was tested in 2009 and became operational in 2010, replacing the earlier inclusion of pressure and surge ranges.2
The scale provides a general idea of potential damage. It does not account for rainfall, flooding, storm surge, or the size of the wind field, all of which can make a lower-category storm far more destructive than its number suggests.
| Category | Winds (mph) | Winds (km/h) | Expected Damage |
|---|---|---|---|
| 1 | 74–95 | 119–153 | Roof damage to frame homes, fallen tree branches, widespread power outages lasting days |
| 2 | 96–110 | 154–177 | Major roof and siding damage, many trees snapped or uprooted, power outages lasting days to weeks |
| 3 | 111–129 | 178–208 | Devastating damage. Well-built homes suffer major damage, trees snapped, electricity and water unavailable for days to weeks |
| 4 | 130–156 | 209–251 | Catastrophic damage. Well-built homes lose most of the roof and exterior walls, most trees snapped, power outages lasting weeks to months |
| 5 | 157+ | 252+ | Catastrophic damage. High percentage of frame homes destroyed, fallen trees and power lines isolate residential areas, power outages lasting weeks to months |
Category 3, 4, and 5 hurricanes are classified as major hurricanes. On average, the Atlantic produces about three major hurricanes per season.
Storm Surge and Other Hazards
Wind speed gets the most attention, but it is not the deadliest aspect of a hurricane. The greatest threat to life in a landfalling hurricane is water, primarily storm surge and inland flooding from rainfall.
Storm Surge
Storm surge is an abnormal rise of water generated by a hurricane's winds pushing ocean water toward shore. It is not the same as a wave or a tide. Surge is a broad dome of water, sometimes 50 to 100 miles (80 to 160 km) wide, that can raise water levels 10 to 20 feet (3.0 to 6.1 m) or more above the normal tide. The combination of surge and the astronomical tide is called storm tide, whether the tide is high or low, and the flooding can extend miles inland in low-lying areas.
The magnitude of storm surge depends on several factors beyond wind speed: the slope of the continental shelf, the angle at which the storm approaches the coast, the size of the wind field, and the forward speed of the hurricane. A large, slow-moving Category 2 storm can produce more surge than a compact, fast-moving Category 4. This is one of the key limitations of the Saffir-Simpson scale. It measures wind, but it cannot predict surge.
Storm surge was a major cause of direct deaths in Katrina; the revised total also includes indirect and indeterminate deaths. Surge reached roughly 24–28 feet along parts of Mississippi. In the Great Galveston Hurricane of 1900, a surge of approximately 15 feet (4.6 m) inundated the entire city, killing an estimated 6,000 to 12,000 people in what remains the deadliest natural disaster in U.S. history.3
Inland Flooding
Heavy rainfall can cause catastrophic floods far inland. Harvey (2017) produced more than 60 inches of rain in southeastern Texas. The ranking of flood, surge, and wind fatalities depends on the period studied; the cited 1963–2012 study does not support calling inland flooding the leading cause for all modern U.S. hurricanes.3
Tornadoes
Landfalling hurricanes frequently spawn tornadoes, particularly in the outer rainbands on the right-front quadrant of the storm relative to its motion. These tornadoes are typically short-lived and on the weaker end of the tornado intensity scale, but they add another layer of danger and can occur well ahead of the main hurricane wind field, sometimes catching people by surprise.
How Hurricanes Move
Hurricanes do not have engines. They are carried along by the large-scale wind patterns of the atmosphere, sometimes called steering currents. In the tropics, the prevailing trade winds push storms westward and slightly toward the poles. As a storm moves into higher latitudes, it often encounters the westerlies, which can redirect it toward the northeast.
Recurvature
This change in direction is called recurvature. A hurricane that begins heading west-northwest across the Caribbean may slow down, turn north, and then accelerate northeast across the open Atlantic. Not all storms recurve. Some continue westward into Central America or the Gulf of Mexico. The path depends on the position and strength of the subtropical ridge, a persistent belt of high pressure that acts as a steering wall.
Rapid Intensification
One of the most dangerous behaviors a hurricane can exhibit is rapid intensification, defined as an increase in maximum sustained winds of at least 30 knots (about 35 mph or 56 km/h) within 24 hours. Many major hurricanes undergo rapid intensification, but the fraction depends on the dataset and definition. The phenomenon catches forecasters and communities off guard because a storm that poses moderate risk in the morning can become a Category 4 monster by nightfall.
Rapid intensification tends to occur when a hurricane moves over exceptionally warm water with low wind shear and high ocean heat content. Predicting exactly when it will happen remains one of the biggest challenges in tropical meteorology.
Eyewall Replacement Cycles
Strong hurricanes sometimes undergo eyewall replacement cycles. Outer rainbands organize into a new, larger eyewall that encircles the original. The inner eyewall, starved of moisture and angular momentum, weakens and collapses. During this process, the storm temporarily weakens. Once the outer eyewall contracts and takes over, the hurricane can re-intensify, sometimes reaching even greater strength than before. These cycles can repeat multiple times in long-lived storms.
How Hurricanes Weaken
Several forces work to destroy a hurricane once conditions turn unfavorable.
Landfall
When a hurricane moves over land, it loses contact with the warm ocean water that powers it. Surface friction over land is also far greater than over water, which slows the wind circulation and disrupts the organized inflow. Most hurricanes weaken rapidly after landfall, though they can still produce damaging winds, torrential rain, and flooding well inland. The speed of weakening depends partly on the geography. A hurricane crossing the narrow Florida peninsula may emerge into the warm Gulf of Mexico and re-strengthen, while one that makes landfall on a large continental landmass typically decays within 24 to 48 hours.
Cool Water
Cooler water can reduce the energy available to a hurricane. Wind-driven turbulent mixing and upwelling can cool the surface beneath it. Upwelling is not caused by the low-pressure center sucking cold water upward.
Wind Shear
An increase in vertical wind shear, often caused by an approaching upper-level trough or jet stream disturbance, can tilt the storm and shear the thunderstorm towers away from the low-level center. Without the vertical alignment needed to concentrate heat, the storm falls apart.
Hurricane Records and Notable Storms
Certain storms stand out in the historical record for their intensity, size, or impact. The Atlantic hurricane record extends back reliably to the mid-20th century, when aircraft reconnaissance became routine, though historical records and ship logs push the documented history back several centuries. Satellite coverage beginning in the 1960s transformed our ability to track every storm across the open ocean, and modern reanalysis projects continue to refine the historical record.
| Record | Details |
|---|---|
| Example of extreme Atlantic winds | Hurricane Allen (1980): 190 mph (165 kt) estimated sustained winds; record comparisons require the latest best-track data |
| Extreme one-minute wind estimate | Hurricane Patricia (2015, E. Pacific): 215 mph (346 km/h) sustained |
| Lowest pressure (Atlantic) | Hurricane Wilma (2005): 882 mb |
| Deadliest (U.S.) | Great Galveston Hurricane (1900): 6,000–12,000 killed |
| Costliest (U.S.) | Hurricane Katrina: $125 billion (2005 dollars); Hurricane Harvey: $125 billion (2017 dollars). Different price years; not an inflation-adjusted ranking. |
| Example of a very large wind field | Hurricane Sandy (2012): wind field over 1,000 miles (1,600 km) wide |
The Atlantic Hurricane Season
The Atlantic hurricane season officially runs from June 1 through November 30. The peak of activity falls between late August and late September, centered around September 10. This is when sea surface temperatures reach their annual maximum and atmospheric conditions are most favorable for storm development.
Based on the 1991 to 2020 climatological average, a season averages 14 named storms, 7 of which become hurricanes and 3 of which reach major hurricane status (Category 3 or higher).1 Individual seasons vary widely. Some produce fewer than five named storms while the record 2020 season produced 30 named storms.
Large-scale climate patterns strongly influence seasonal activity. El Nino years tend to suppress Atlantic hurricane development by increasing upper-level wind shear across the basin. La Nina years do the opposite, reducing shear and often leading to above-average seasons.
Hurricane Naming
Tropical storms and hurricanes are given names to make public communication clearer and faster, especially when multiple storms are active at the same time. The World Meteorological Organization maintains six rotating lists of names for the Atlantic basin. Each list is used once every six years and then recycled. If a storm is particularly deadly or costly, its name is retired and replaced with a new one. Among the retired names are Katrina, Sandy, Harvey, Maria, and Irma.
Before the modern naming system began in 1953, storms were sometimes identified by the year and order of occurrence or by the location they struck. The shift to human names made it far easier for the public, the media, and emergency managers to track and communicate about individual storms during busy seasons.
How Hurricanes Are Forecast
Hurricane forecasting relies on a combination of satellite observations, reconnaissance aircraft, ocean buoys, weather balloons, and computer models. The National Hurricane Center in Miami coordinates Atlantic basin forecasts and issues official advisories every six hours when a tropical system is active, with intermediate updates every three hours when the storm threatens land.
Both track and intensity forecasts have improved over the long term, though yearly errors fluctuate and rapid intensity changes remain difficult. NHC publishes verification by forecast lead time; these are average errors, not guarantees for an individual storm.4
Air Force Reserve and NOAA reconnaissance aircraft measure conditions in and around storms. Dropsondes report pressure, temperature, humidity, and winds as they fall. These observations complement satellites and other measurements; satellite estimates are valuable, not merely guesses.
The cone of uncertainty is the most misread graphic in American weather. It shows the probable track of the storm's center, not the extent of hazardous conditions. Tropical storm-force winds, storm surge, and heavy rainfall often reach far beyond the cone, so residents outside it are not safe by default, and it should never be used as a boundary for preparation decisions.
Hurricanes and Climate Change
The relationship between hurricanes and a warming climate is an active area of research. Several trends are supported by observations and modeling.
Intensity. Research projects higher average tropical-cyclone intensity and a larger proportion of very intense storms in a warmer climate. A projection must identify the warming scenario, basin, and metric.5
More rapid intensification. Warmer waters create conditions that favor rapid intensification, meaning more storms are likely to strengthen explosively in short periods. This makes forecasting and evacuation timing more difficult.
Rainfall. Warmer air can hold more moisture, and models project heavier tropical-cyclone rainfall. The amount varies with warming, location, and the averaging area; an event-specific attribution percentage should not be generalized to all hurricanes.5
Inland effects. Some studies find slower weakening after landfall, but the interpretation and geographic generality remain under study. Inland flood risk also depends on rainfall, terrain, soil conditions, and exposure.
What the research does not clearly show is a significant increase in the total number of hurricanes. The trend, to the extent one exists, may lean slightly toward fewer but stronger storms. The science continues to develop.
Preparedness Basics
Preparation for a hurricane should begin long before a storm enters the forecast. Residents in hurricane-prone areas should know their evacuation zone, have a written plan that accounts for pets and family members with special needs, and maintain a supply kit with at least three days of water, non-perishable food, medications, important documents, flashlights, and a battery-powered weather radio.
A hurricane watch means hurricane conditions are possible; a warning means they are expected. They are generally issued 48 and 36 hours, respectively, before the anticipated onset of tropical-storm-force winds, which can make preparations unsafe. Evacuation orders from local officials should be taken seriously. The most dangerous decision during a hurricane is choosing to stay in a surge-prone area after an evacuation order has been given.
After the storm passes, hazards remain. Flooded roads can hide downed power lines, contaminated water, and structural damage. Standing water may contain sewage, chemicals, or displaced wildlife. Generators must be operated outdoors, at least 20 feet from doors, windows, and vents, with exhaust directed away from occupied buildings, and never indoors due to the risk of carbon monoxide poisoning, which kills more people in the aftermath of hurricanes than many realize.
Continue Exploring
This guide is the entry point. From here the site goes deeper by section: the historic storms that shaped the coast in History, what hurricanes do to communities in Impacts, the science of predicting them in Forecasting, building to withstand them in Engineering, the aircraft that fly into them in Aviation, and hurricane science for younger readers in Kids. To put a storm's structure in motion, try the interactive tools in SimStorm.
Sources
-
National Hurricane Center. (2024). Tropical Cyclone Climatology. NOAA. https://www.nhc.noaa.gov/climo/ ↩ ↩2
-
Schott, T., Landsea, C., Hafele, G., et al. (2012). The Saffir-Simpson Hurricane Wind Scale. National Weather Service / National Hurricane Center. https://www.nhc.noaa.gov/pdf/sshws.pdf ↩
-
Rappaport, E. N. (2014). Fatalities in the United States from Atlantic tropical cyclones: New data and interpretation. Bulletin of the American Meteorological Society, 95(3), 341–346. https://doi.org/10.1175/BAMS-D-12-00074.1 ↩ ↩2
-
National Hurricane Center. 2025 verification report preview. Long-term track and intensity trends. ↩
-
Knutson, T. R., et al. (2020). Tropical cyclones and climate change assessment: Part II. Projected response to anthropogenic warming. Bulletin of the American Meteorological Society, 101(3), E303–E322. https://doi.org/10.1175/BAMS-D-18-0194.1 ↩ ↩2