Hurricane reconnaissance aircraft carry some of the most specialized meteorological instruments ever built, and a hurricane forecast is only as good as the pipeline that turns their raw measurements into guidance. That pipeline runs from expendable dropsondes and advanced radar through satellites and numerical models to the products a forecaster and a dispatcher actually read. This article walks each major tool in turn: what it measures, how it works, and why it matters for hurricane operations and aviation safety.
Vortex Data Messages
The Vortex Data Message (VDM) is the single most important real-time report sent from a reconnaissance aircraft to the National Hurricane Center. Each VDM is a coded message giving a concise snapshot of conditions at the center of a tropical cyclone, compiled by the flight meteorologist during or just after an eyewall penetration and sent by satellite, usually reaching NHC within minutes.1
A standard VDM carries the center fix (latitude and longitude), the maximum flight-level wind observed on the pass, the minimum sea-level pressure extrapolated from flight-level and dropsonde data, the maximum surface wind estimated from SFMR and other observations, the diameter and shape of the eye (circular, elliptical, or irregular), and a description of the wall cloud, including its height, completeness, and any sign of concentric eyewalls.
The VDM format is codified in the OFCM National Hurricane Operations Plan, which standardizes reconnaissance reporting across the Air Force Reserve's 53rd Weather Reconnaissance Squadron and NOAA's Aircraft Operations Center. That standardization means NHC forecasters get consistent, comparable data no matter which agency is flying, and the VDM is one of several aircraft products used by forecasters.
NHC specialists use VDM data directly when writing the Tropical Cyclone Public Advisory and the Forecast Discussion. The center fix updates the official position, while the pressure and winds drive the intensity classification. During a hurricane threatening land, VDMs may arrive every few hours from successive passes, giving forecasters a nearly continuous picture of how the storm is changing.
Dropsondes and Vertical Profiles
Dropsondes fall by parachute while measuring the atmosphere. Fall speed changes with altitude, and instrument models differ. NCAR’s currently supported NRD41 uses the same electronics as the larger RD41 in a smaller package.2
NCAR lists xRD41 uncertainties of ±0.5 hPa for pressure, ±0.2°C for temperature, ±3 percentage points for relative humidity and ±0.5 m/s for horizontal wind. The last value is not a wind-direction uncertainty. The older 1999 paper describes an earlier instrument generation.2
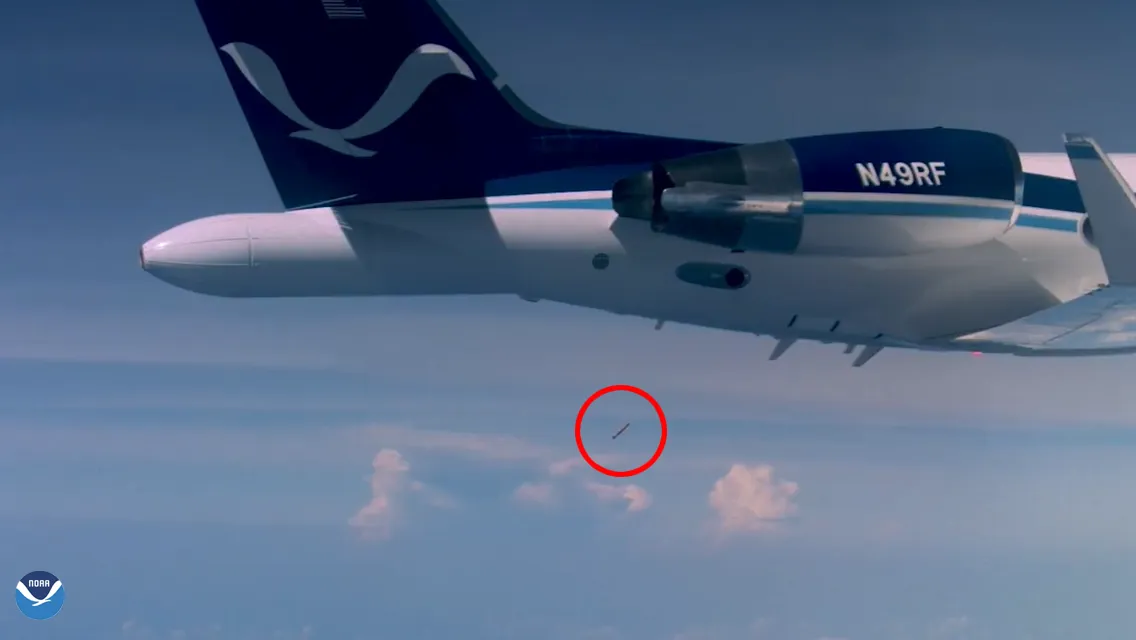
A dropsonde samples one descending path. An eye drop can help estimate central pressure, but may miss the pressure minimum. NHC’s intensity classification uses maximum sustained surface wind, not pressure alone.
Seasonal deployment totals vary. The GPS dropwindsonde described by Hock and Franklin (1999) improved on older radio-navigation systems; present instrument specifications should come from current documentation.3
Stepped Frequency Microwave Radiometer
The Stepped Frequency Microwave Radiometer (SFMR) is a passive microwave sensor that reads surface wind speed and rain rate from altitude. Where dropsondes give point measurements, the SFMR gives a continuous read of surface wind along the whole flight track, which makes it one of the most important tools for mapping a hurricane's wind field.
The SFMR works at multiple C-band frequencies. At those frequencies, ocean emissivity depends strongly on wind-driven sea-surface roughness: as the wind rises, the surface roughens and its microwave brightness temperature climbs. By reading brightness temperatures at multiple frequencies, the SFMR can solve for surface wind and rain rate at once, separating the two.
SFMR retrieves ocean-surface wind from microwave observations; it is not a direct anemometer measurement. Accuracy varies with rain, wind regime and retrieval version. Forecasters compare it with dropsondes and flight-level winds rather than applying one universal error bound.4
Tail Doppler Radar
NOAA's WP-3D Orions carry an X-band (9.3 GHz) tail Doppler radar that returns three-dimensional wind fields inside hurricanes. It uses a fore-aft scanning technique (FAST), alternating the antenna between angles ahead of and behind the aircraft; combining the radial velocities from the two look angles lets forecasters reconstruct the full 3-D wind field.
Doppler analyses resolve storm-scale structure at a resolution determined by sampling and processing. They cannot resolve every small eyewall vortex or boundary-layer feature.5
Real-time dissemination of the Doppler wind fields, described by Gamache (2005), lets NHC and research meteorologists visualize the storm's 3-D structure during the mission. It's been especially valuable for spotting eyewall replacement cycles, a primary cause of intensity-forecast errors: when a concentric eyewall shows up on the radar, forecasters can anticipate a temporary weakening followed by possible re-intensification.
C-130J Radar Capabilities
The WC-130J’s navigation/weather radar is not the P-3’s research tail-Doppler system. A claim that it has no Doppler capability confuses navigation-radar functions with retrieval of a three-dimensional storm wind field.
Satellite Products Used by Aviation
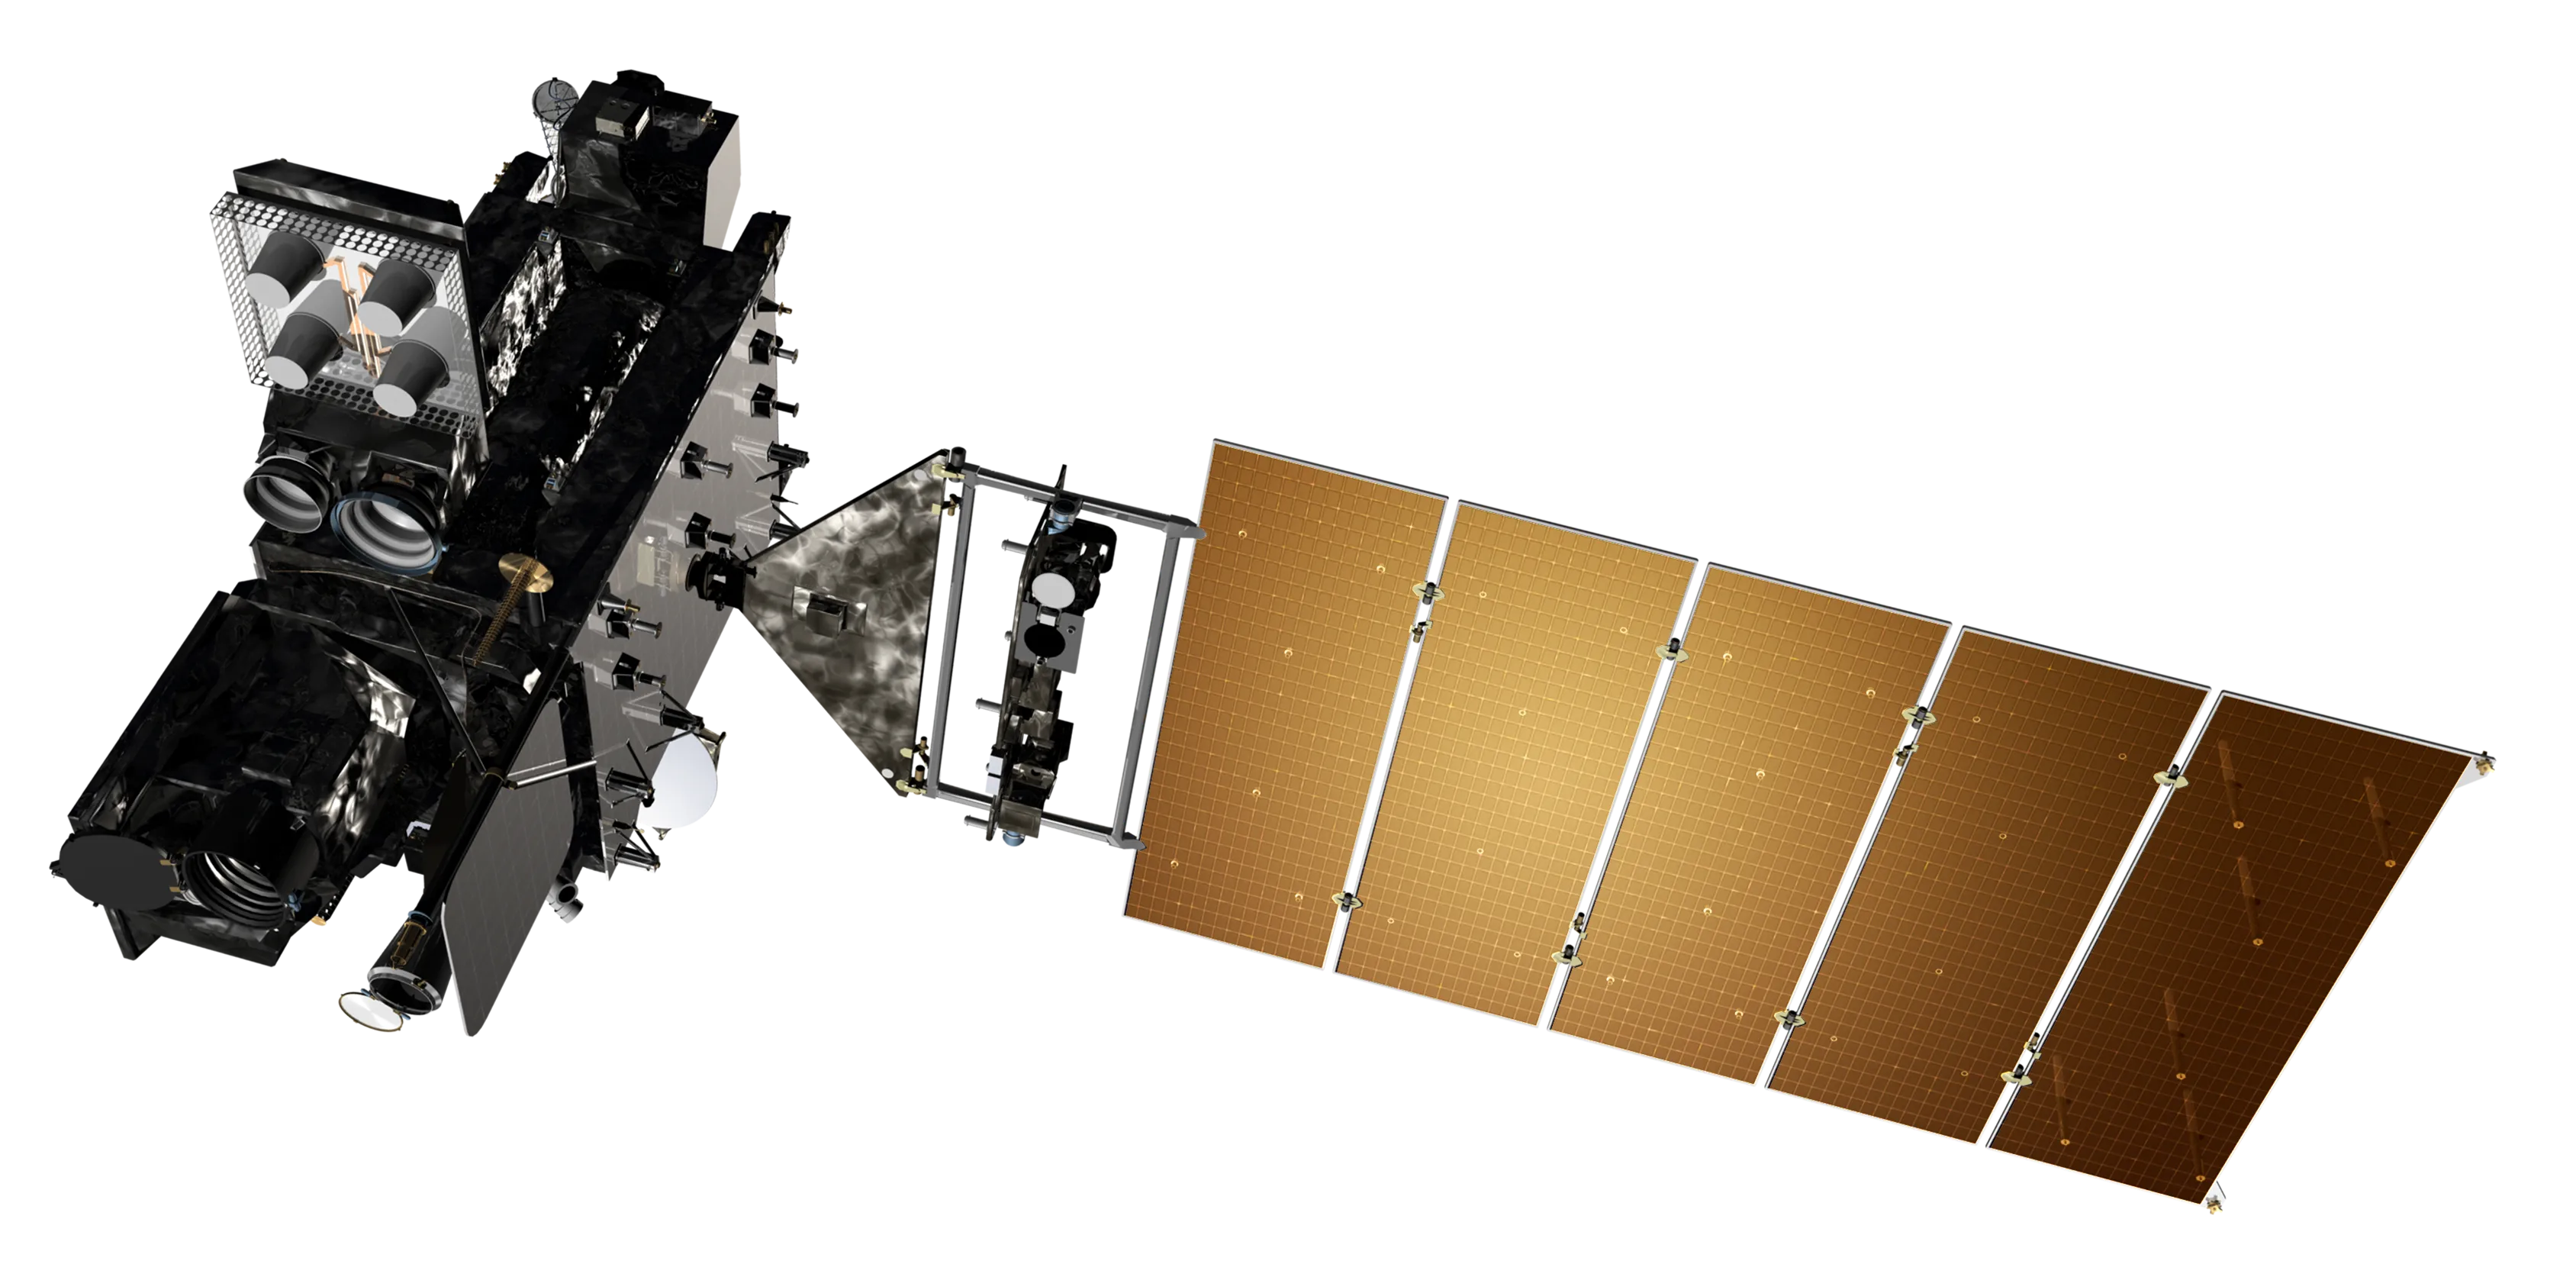
Aircraft and satellites provide complementary observations. GOES-19 replaced GOES-16 as GOES-East in April 2025; GOES-18 serves as GOES-West. One-minute ABI imagery applies to selected mesoscale sectors, not the entire hurricane basin.6
The Dvorak Technique
The Dvorak technique for satellite-based intensity estimation was developed in the 1970s by Vernon Dvorak at NOAA's National Environmental Satellite, Data, and Information Service. It recognizes cloud patterns in infrared and visible imagery, assigning a "T-number" and a corresponding "Current Intensity" (CI) number that translate to an estimated maximum sustained wind. As documented by Velden et al. (2006), Dvorak remains the foundation of satellite-based intensity estimation worldwide.7
Satellite intensity estimates have uncertainty, especially when structure is unusual or changing quickly. ADT automates parts of the Dvorak approach; SATCON combines several satellite estimates. Aircraft observations provide additional evidence, not a reason to dismiss satellite products as guesses.7
Microwave Satellite Imagery
Polar-orbiting satellites carrying microwave imagers, including the Special Sensor Microwave Imager/Sounder (SSMIS) and the Advanced Microwave Scanning Radiometer 2 (AMSR-2), return imagery that can see through the cirrus canopy over a hurricane. That lets forecasters spot a low-level eye even when upper-level clouds hide it in visible and infrared imagery, which is especially valuable early in intensification, when the eye may be forming beneath a dense cirrus overcast.
Numerical Weather Prediction for Aviation
Aircraft data is critical for initializing and improving the numerical models that forecast track and intensity. The primary hurricane-specific model has historically been the Hurricane Weather Research and Forecasting (HWRF) model, a coupled atmosphere-ocean model run at high resolution around the storm center. HWRF is being replaced by the Hurricane Analysis and Forecast System (HAFS), which brings more advanced physics, higher resolution, and improved data assimilation.
For track guidance, forecasters also lean on global models including the Global Forecast System (GFS) run by NOAA and the European Centre for Medium-Range Weather Forecasts (ECMWF) model, which capture the large-scale steering patterns that set a hurricane's path. Intensity guidance comes from ensemble approaches like the Intensity Consensus (ICON) and the Intensity Variable Consensus (IVCN), which blend predictions from several models.
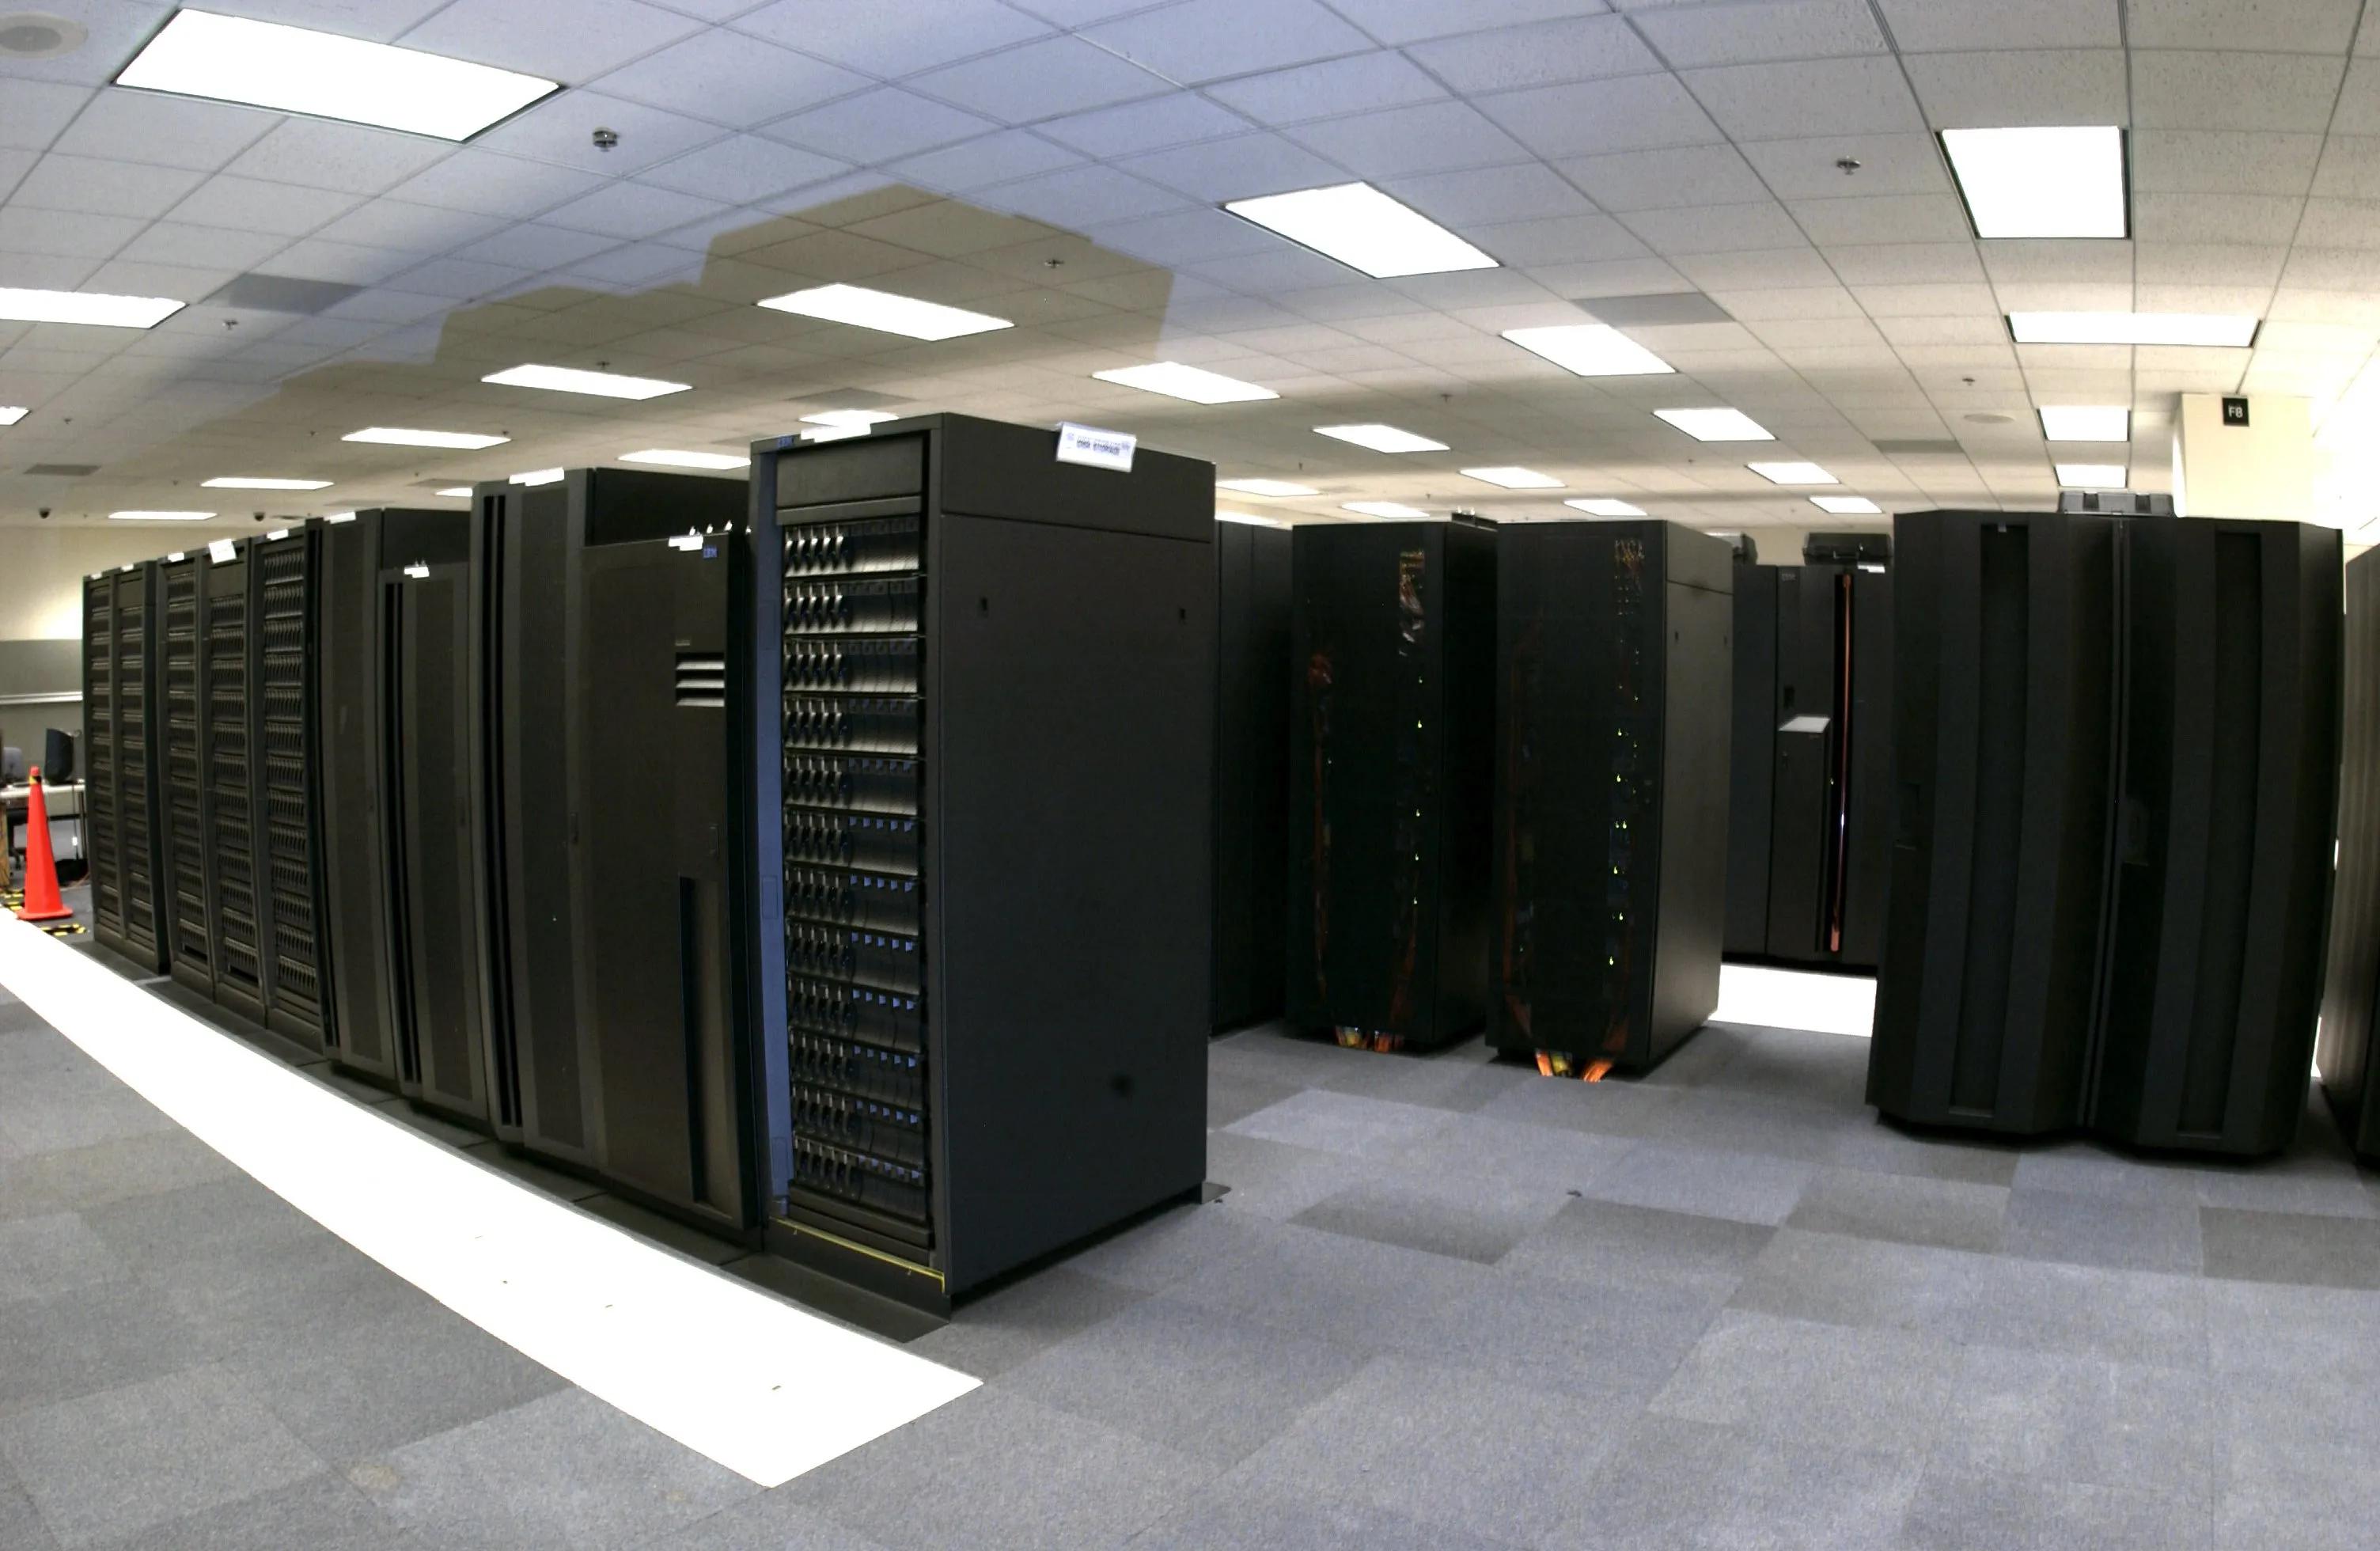
Consensus guidance often performs well over many cases, but cannot be assumed to outperform every member for every metric or storm. Model errors can be correlated. SHIPS provides statistical intensity guidance using storm and environmental predictors.
Data Assimilation
Data assimilation combines selected quality-controlled observations with a model background. Which reconnaissance products are assimilated depends on the model and version. Improvements must be evaluated with appropriate experiments; an SFMR verification paper is not evidence that every data type is used by every model.
NHC Products for Aviation
NHC issues full tropical-cyclone advisory packages every six hours, with intermediate public advisories and special updates when conditions warrant. The Forecast/Advisory includes forecast positions and winds through five days; the Public Advisory provides a public-facing summary. Issue times vary with basin and daylight saving time.
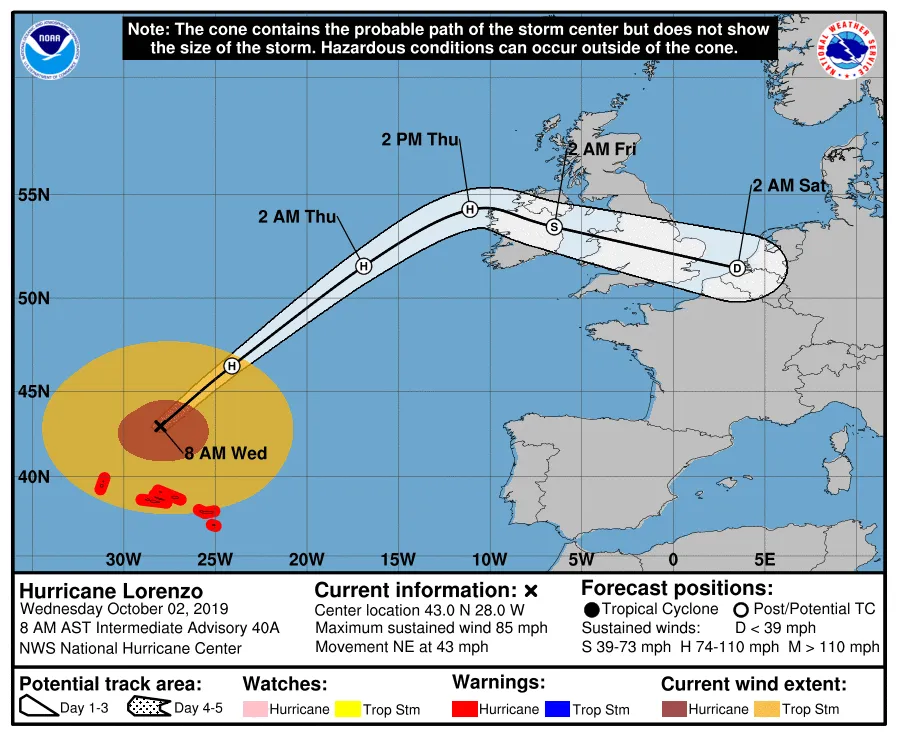
The Tropical Cyclone Forecast Discussion lays out the forecasters' reasoning, including which models they're favoring and why. The Tropical Cyclone Wind Speed Probabilities product gives the odds of sustained winds crossing specified thresholds at individual locations. The Tropical Cyclone Track Forecast Cone, introduced in 2002, shows the probable track of the center within a swath sized to the distribution of recent historical track errors.
Aviation-Specific Products
International SIGMETs can warn of tropical cyclones within the issuing meteorological watch office’s area. AWC is one U.S. provider; it is not the issuer for all global tropical-cyclone SIGMETs. Use the current aviation briefing for the route.8
Pilot Decision-Making Tools
Electronic flight bags may display storm tracks and aviation warnings, depending on the product, subscription and coverage. Check valid times and obtain the required flight briefing; a displayed forecast cone is not a clearance boundary.
Convective SIGMETs, covering severe thunderstorms and embedded convection, and international SIGMETs for tropical cyclones both show up in these briefing tools. Pilots are also encouraged to file Pilot Reports (PIREPs) when they hit significant turbulence, icing, or other weather near a storm; PIREPs add real-time, pilot-observed conditions that supplement the automated forecasts and help others route better.
AWC also provides turbulence, icing and convective guidance. These are broader aviation products, not all tropical-cyclone-specific products. Hazards can extend far beyond a storm’s center.
No single tool paints the whole hurricane. The strength of modern forecasting is in the integration, dropsonde profiles, SFMR surface winds, Doppler 3-D wind fields, satellite imagery, and model guidance, all synthesized by experienced forecasters at NHC, and increasingly by the machine-learning systems described in the future of hurricane aviation. Every tool on this page is a different way of asking the same question, how strong is this storm and where is it going, and the answer only gets trustworthy when you ask it several ways at once.
Sources
-
Office of the Federal Coordinator for Meteorological Services. (2024). National Hurricane Operations Plan (FCM-P12-2024). OFCM. https://www.icams-portal.gov/resources/ofcm/nhop/2024_full_nhop.pdf ↩
-
NCAR dropsonde specifications. https://www.eol.ucar.edu/content/avaps-dropsondes ↩ ↩2
-
Hock, T. F., & Franklin, J. L. (1999). The NCAR GPS dropwindsonde. Bulletin of the American Meteorological Society, 80(3), 407–420. https://doi.org/10.1175/1520-0477(1999)080%3C0407:TNGD%3E2.0.CO;2 ↩
-
Uhlhorn, E. W., & Black, P. G. (2003). Verification of remotely sensed sea surface winds in hurricanes. Journal of Atmospheric and Oceanic Technology, 20(1), 99–116. https://doi.org/10.1175/1520-0426(2003)020%3C0099:VORSSS%3E2.0.CO;2 ↩
-
Gamache, J. F. (2005). Real-time dissemination of hurricane wind fields from airborne Doppler radar. National Hurricane Center. https://www.nhc.noaa.gov/jht/2003-2005reports/DOPLRgamache_JHTfinalreport.pdf ↩
-
NOAA GOES-R status. https://goes-r.noaa.gov/ ↩
-
Velden, C. S., et al. (2006). The Dvorak tropical cyclone intensity estimation technique. Bulletin of the American Meteorological Society, 87(9), 1195–1210. https://doi.org/10.1175/BAMS-87-9-1195 ↩ ↩2
-
Aviation Weather Center product documentation. https://aviationweather.gov/help/data/ ↩