Hurricanes dominate the list of the United States' costliest natural disasters, a pattern driven less by any single meteorological factor than by where and how Americans build.
Why Hurricanes Top the List
NCEI’s archived U.S. billion-dollar weather and climate disaster series covers 1980–2024 and contains 403 events. It includes tropical cyclones, severe storms, floods, droughts, freezes, wildfires, and winter storms—not earthquakes. Its inflation-adjusted threshold and U.S. scope matter when comparing it with other datasets.1
Examples of large U.S. losses include Katrina ($125 billion in 2005 dollars), Harvey ($125 billion in 2017 dollars), and Ian ($112.9 billion in 2022 dollars), as reported in their NHC assessments. These event-year figures are examples, not an inflation-adjusted ranking. See the individual storm histories for scope and sources.
NOAA announced the retirement of this product on May 8, 2025, with no updates beyond 2024. The announcement says the historical reports and data remain archived and available.2
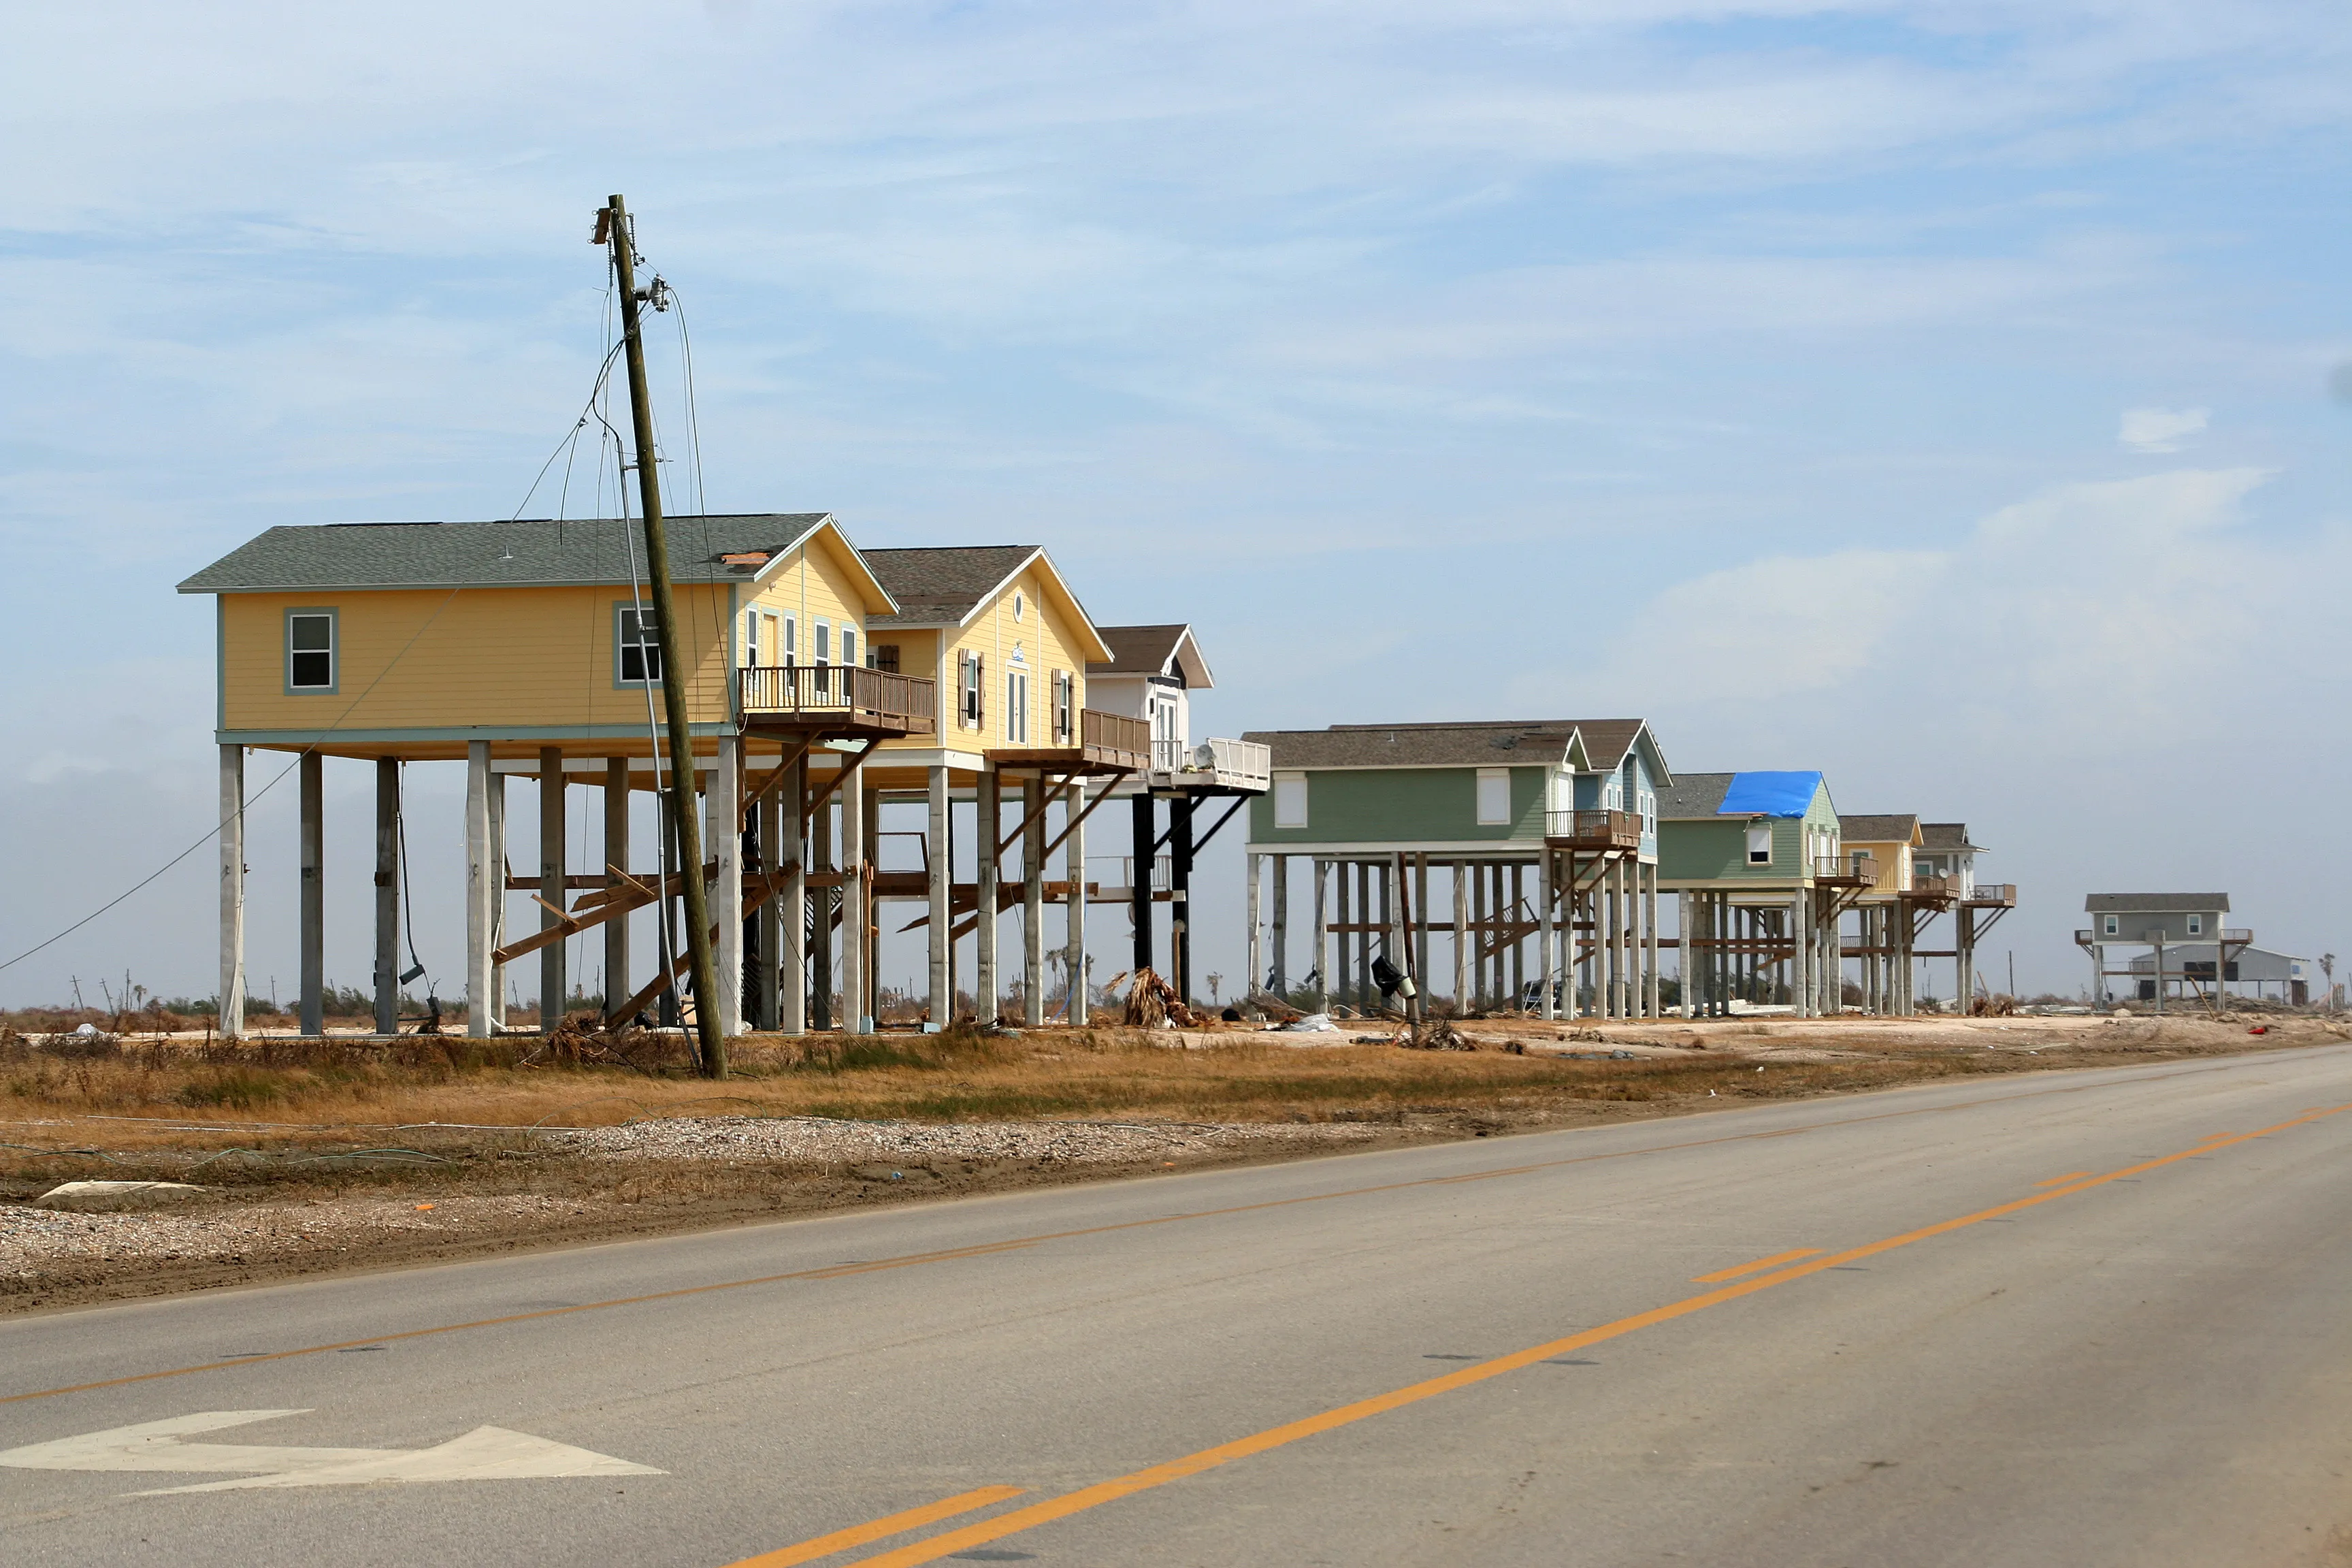
Exposure, Not Just Storms
The cited study normalized continental U.S. hurricane damage over 1900–2017 for inflation, wealth, and population. It found no significant trend in that normalized series. This result concerns that dataset and method; it is not proof that climate change has no effect on losses.3
This does not make climate change irrelevant; warmer oceans and heavier rainfall add to the hazard. But the explosive growth of coastal wealth is the principal reason hurricane costs keep setting records.
The Insurance Gap
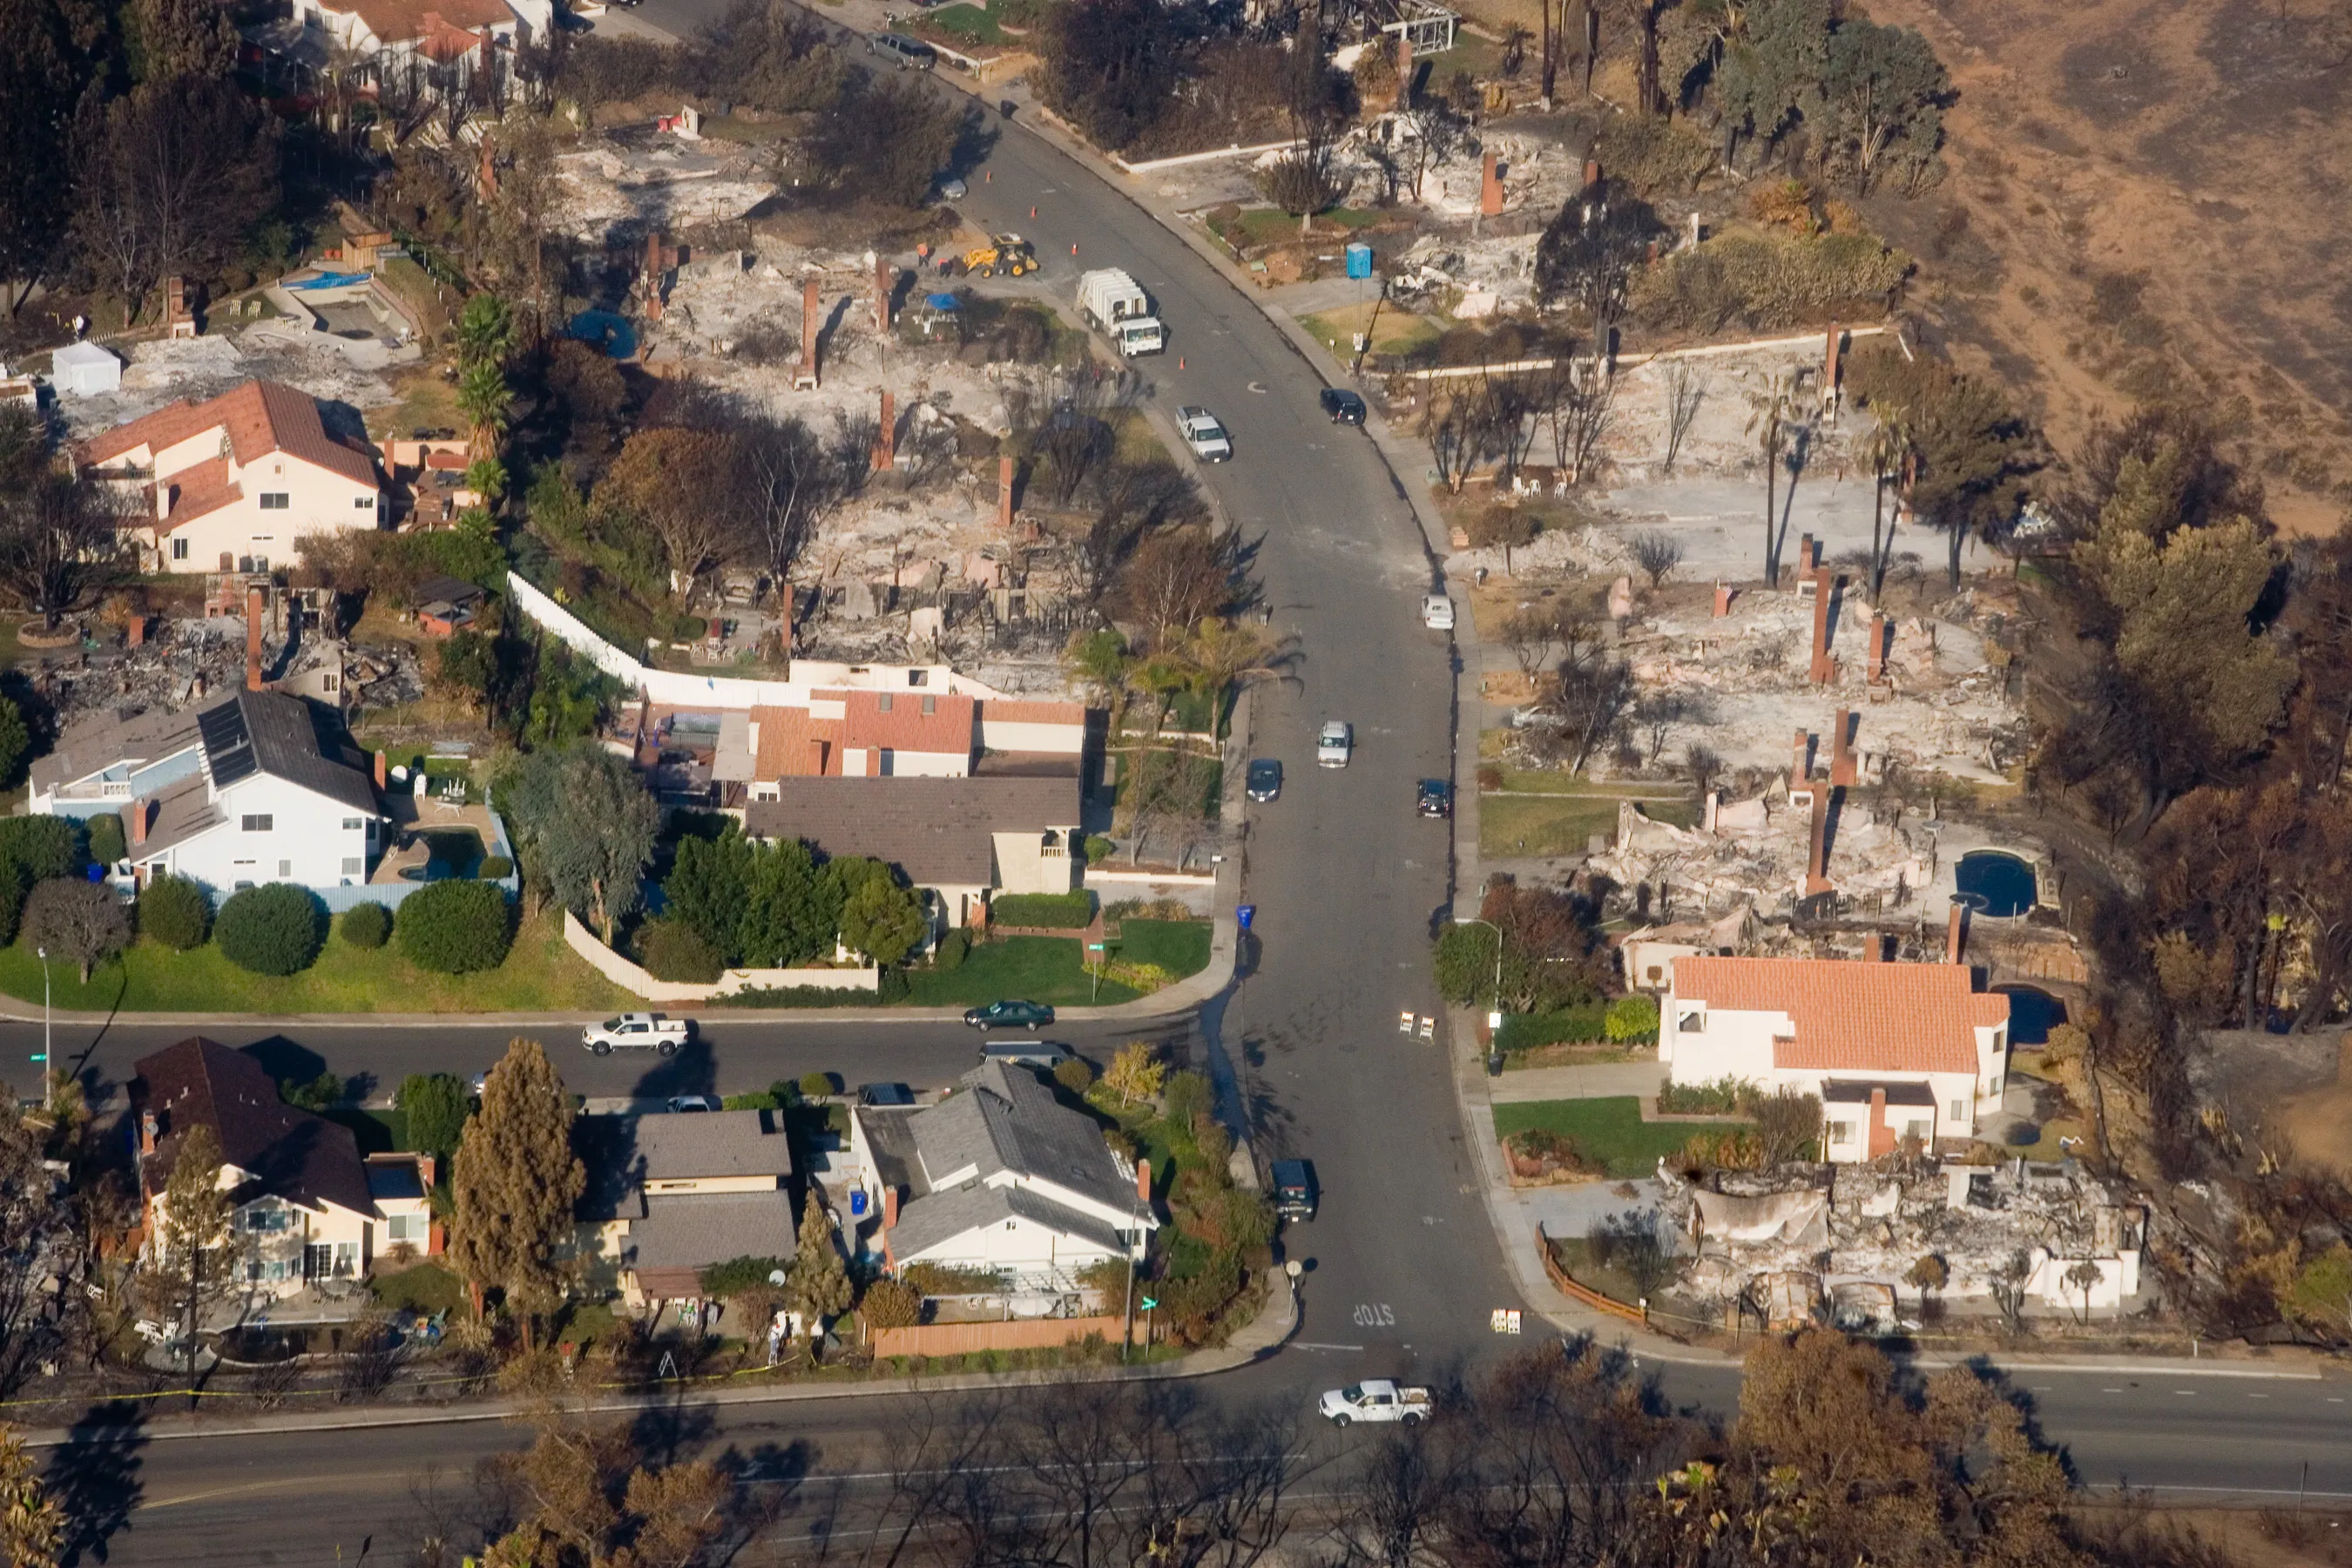
Hurricane costs are amplified by how losses are shared. A large share of hurricane damage, especially flood damage, is uninsured or underinsured, because standard homeowners policies exclude flooding and many residents lack separate flood coverage. Uninsured losses fall on households, small businesses, and government, lengthening recovery and deepening the economic toll.
Global Context
The 2011 Tōhoku earthquake and tsunami illustrates why a U.S. weather-disaster dataset cannot establish worldwide rankings across all hazards. Global comparisons require a separate source with consistent treatment of currency, inflation, physical damage, business interruption, and reconstruction costs.
Costliest Is Not Deadliest
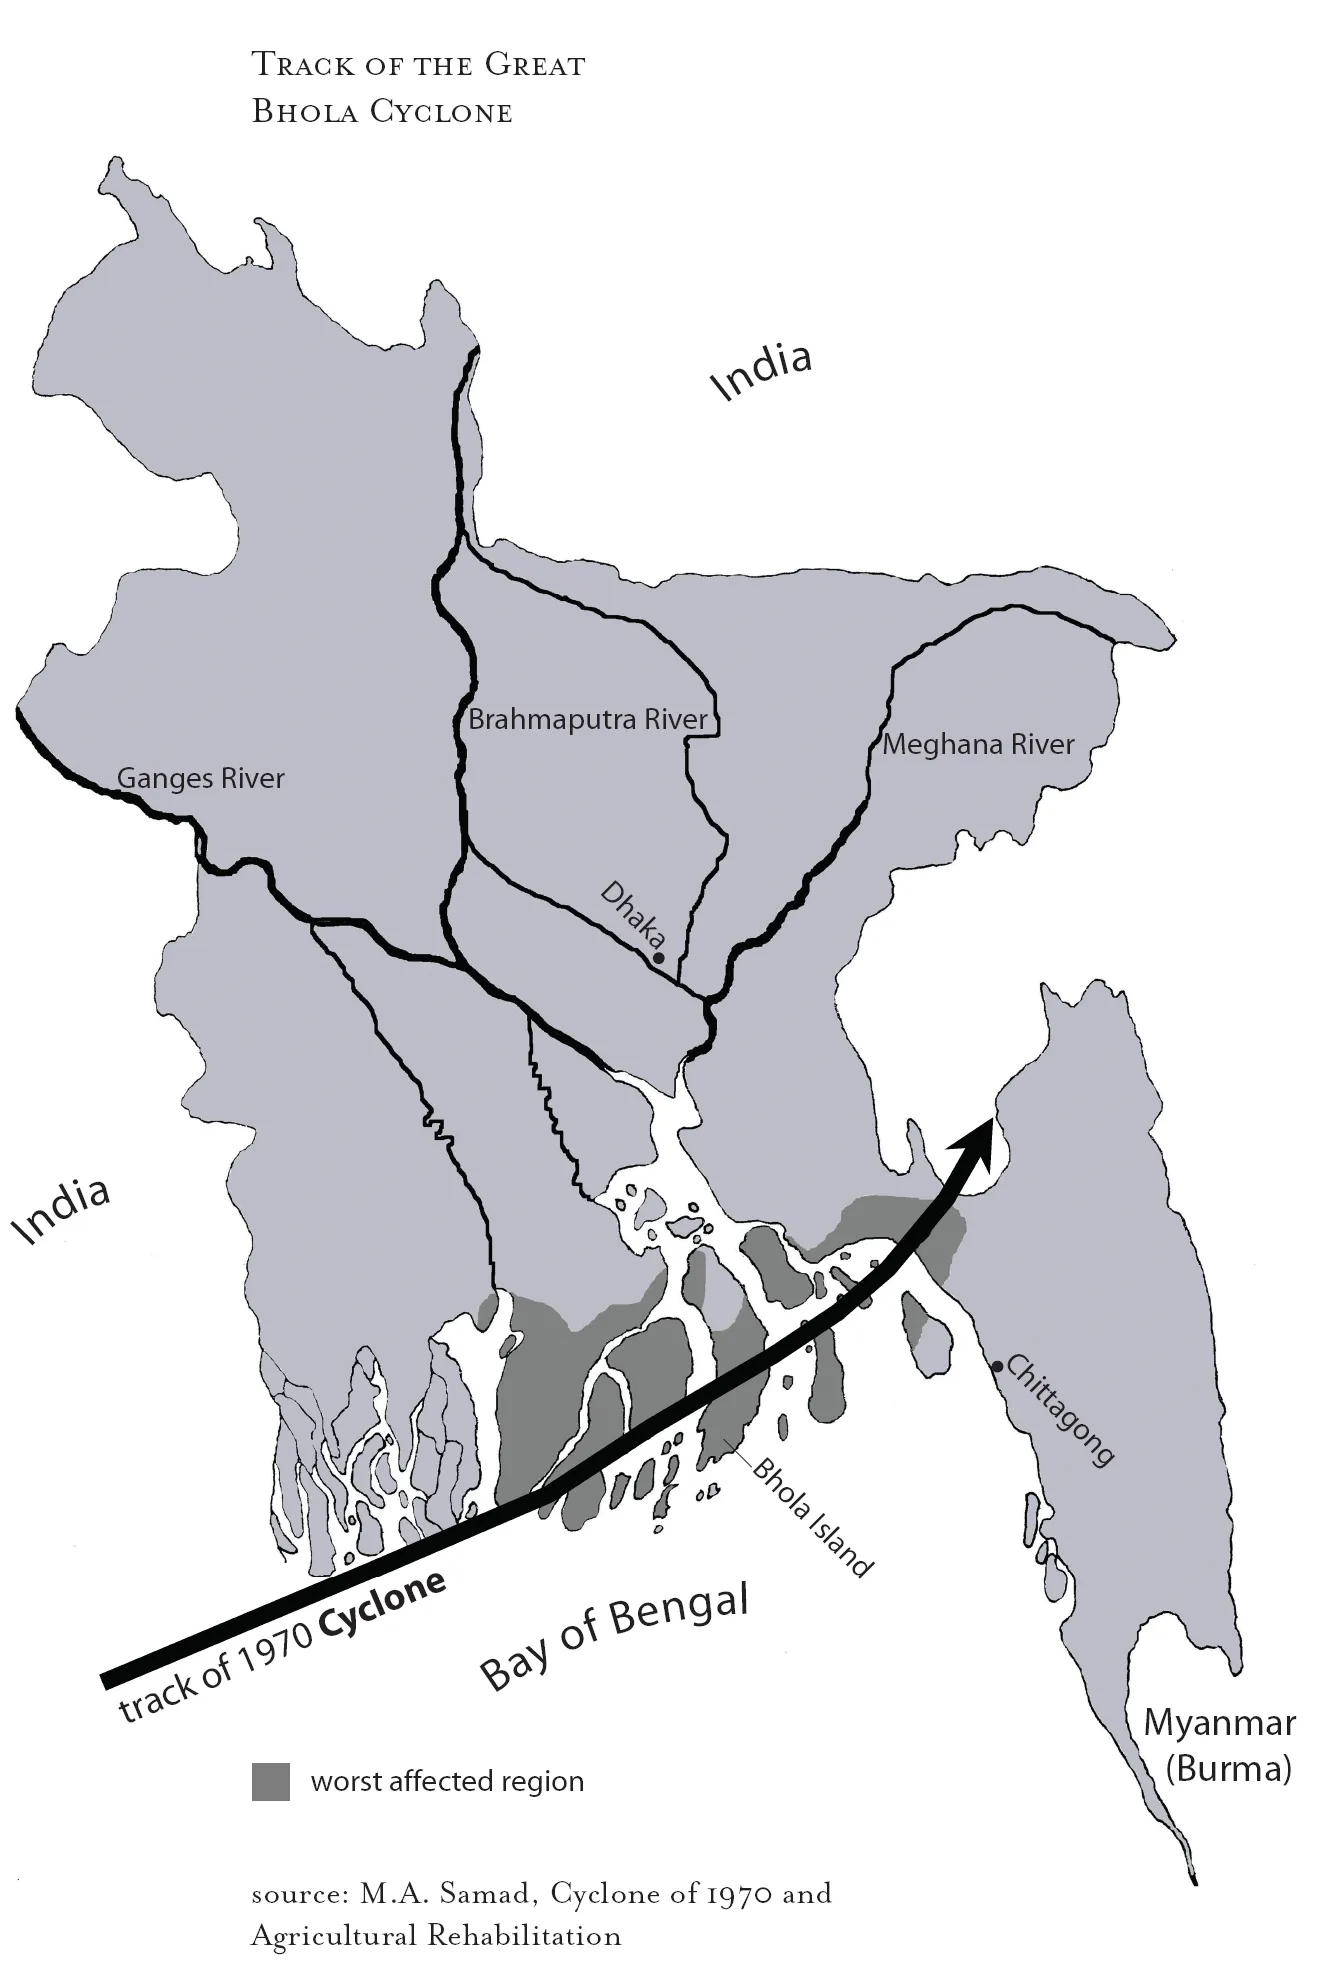
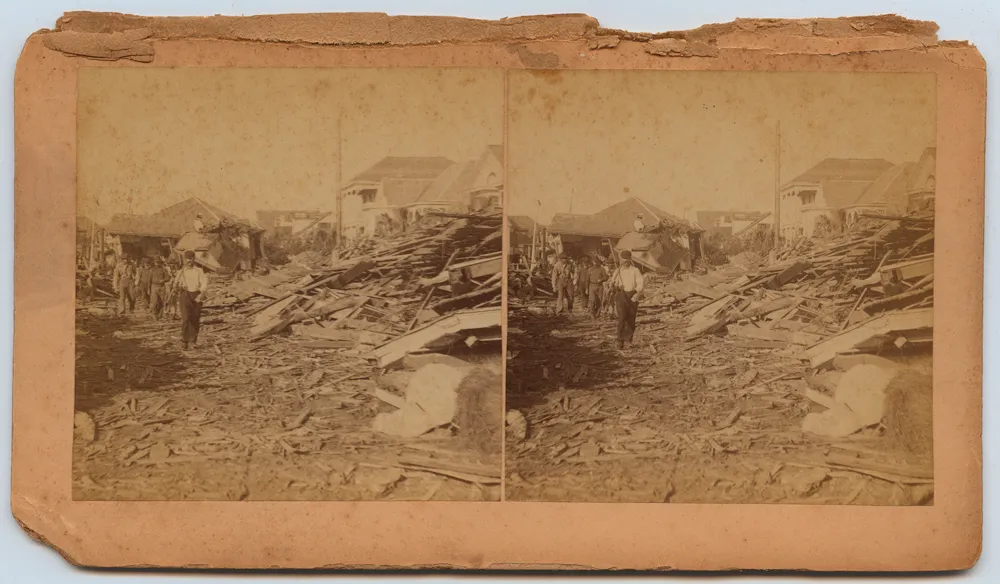
Economic cost and human toll are two very different rankings, and they tend to fall on different parts of the world. The costliest disasters cluster in wealthy, heavily insured nations, where there is simply more value to destroy. The deadliest tropical cyclones, by contrast, have struck poor, densely populated, low-lying deltas with little warning or protection. The 1970 Bhola cyclone, which hit what is now Bangladesh, killed at least 300,000 people, and possibly half a million, almost entirely through storm surge across the Ganges Delta, making it the deadliest tropical cyclone in recorded history.4 In the United States, the deadliest remains the 1900 Galveston hurricane, which killed roughly 8,000 people, yet its dollar cost is trivial next to a modern storm. The distinction matters: dollars measure exposure and wealth, while deaths measure vulnerability and the absence of warning.
Reducing the Toll
NIBS estimated an average benefit of $6 per $1 spent for the federal mitigation grants it studied. Its estimate for adopting modern model building codes was $11 per $1. These are averages across defined portfolios, not guaranteed returns for every project.5
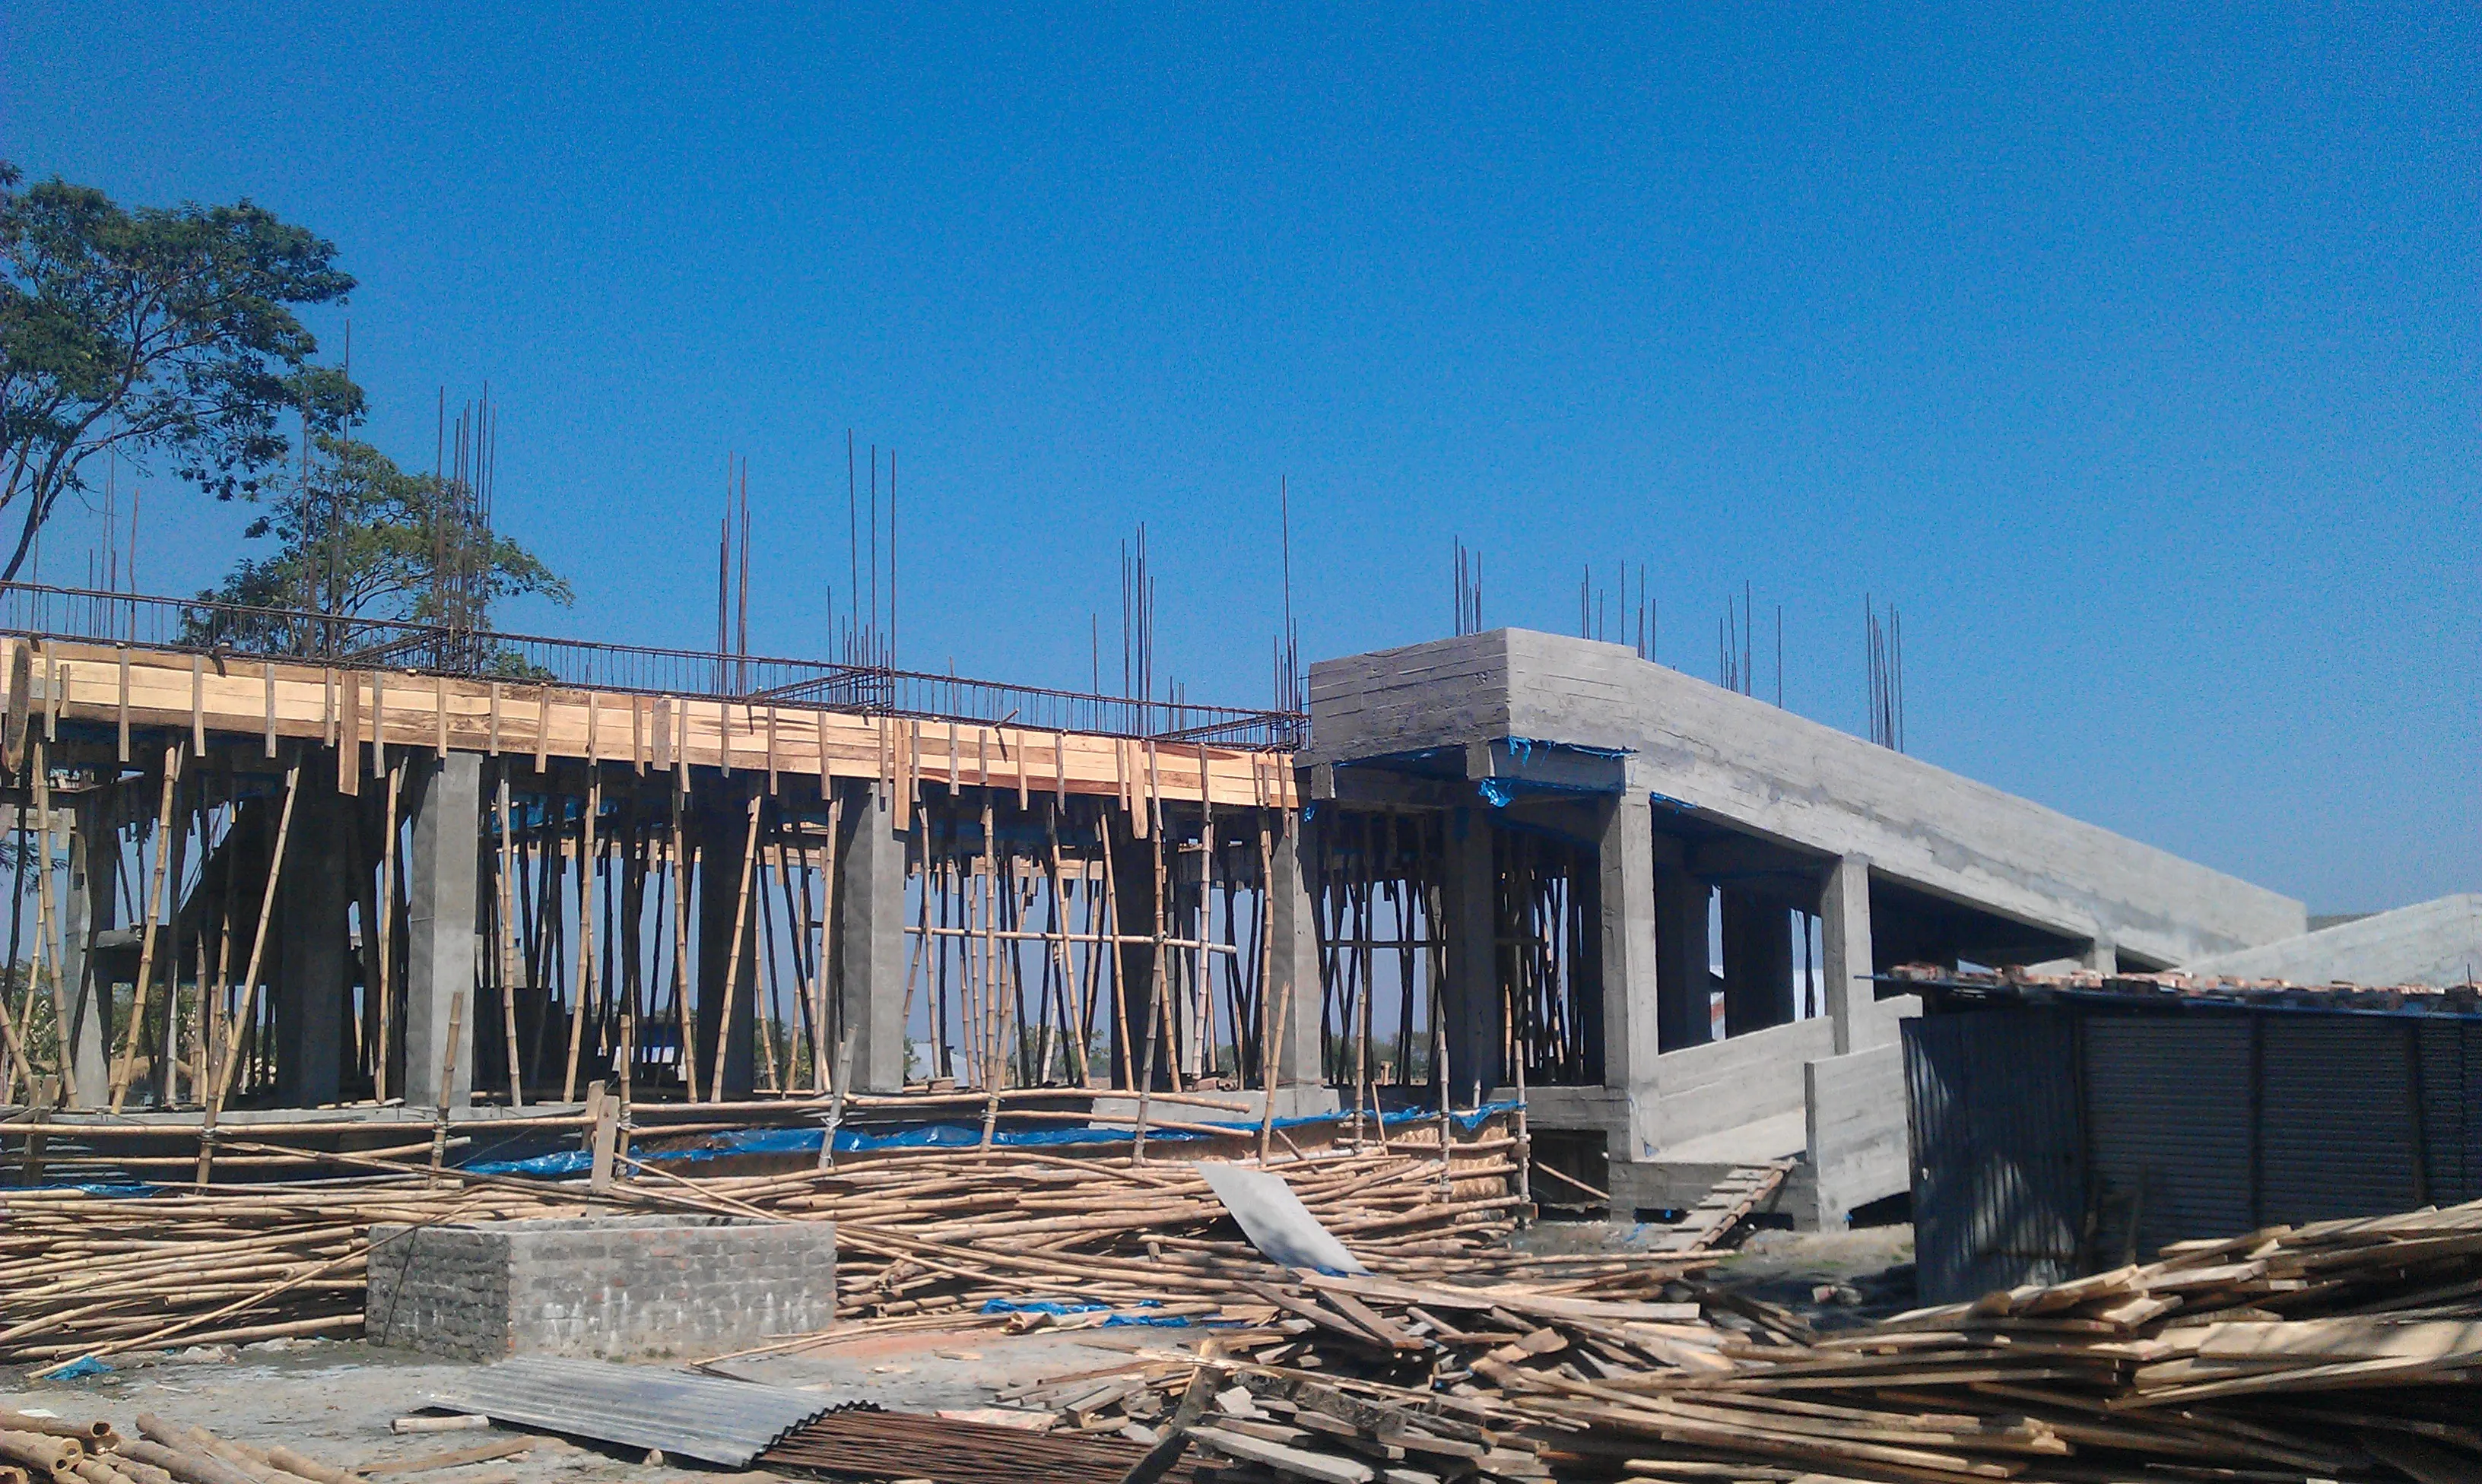
What Actually Bends the Curve
Because hurricane losses are set largely by what gets built and where, they are among the few disaster costs still within reach of policy.1 A useful question is which storm posted the biggest number, but how much of the next decade's rise will come from continued coastal building versus a warming climate. The loss record alone cannot separate the two cleanly, which is a genuine limit on how far these rankings can be pushed. For how those losses land and who ultimately pays, see hurricane damage statistics and government aid after a hurricane; for the storm trends behind the dollar figures, hurricane season trends.
Sources
-
NOAA National Centers for Environmental Information. U.S. Billion-Dollar Weather and Climate Disasters. https://www.ncei.noaa.gov/access/billions/ (DOI: 10.25921/stkw-7w73) ↩ ↩2
-
NOAA NESDIS. (2025). Billion Dollar Weather and Climate Disasters: notice of changes. https://www.nesdis.noaa.gov/about/documents-reports/notice-of-changes/2025-notice-of-changes/billion-dollar-weather-and-climate-disasters ↩
-
Weinkle, J., Landsea, C., Collins, D., Musulin, R., Crompton, R. P., Klotzbach, P. J., & Pielke, R. (2018). Normalized hurricane damage in the continental United States 1900–2017. Nature Sustainability, 1, 808–813. https://doi.org/10.1038/s41893-018-0165-2 ↩
-
World Meteorological Organization (2020). World's deadliest tropical cyclone was 50 years ago. https://wmo.int/media/news/worlds-deadliest-tropical-cyclone-was-50-years-ago ↩
-
National Institute of Building Sciences (2019). Natural Hazard Mitigation Saves: 2019 Report. https://www.nibs.org/projects/natural-hazard-mitigation-saves-2019-report ↩