Atlantic hurricane activity has been recorded for more than 170 years, but understanding its trends requires separating real changes in the storms from changes in our ability to observe them.
What a "Normal" Season Looks Like
Based on the 1991–2020 climatological average, a typical Atlantic season produces about 14 named storms, 7 of which become hurricanes and 3 of which reach major-hurricane status (Category 3 or higher).1 Individual seasons vary enormously, from quiet years with a handful of storms to hyperactive years such as 2005, with 28 named-strength storms (one unnamed), and 2020, with 30 named storms.
Natural Cycles: The AMO and ENSO
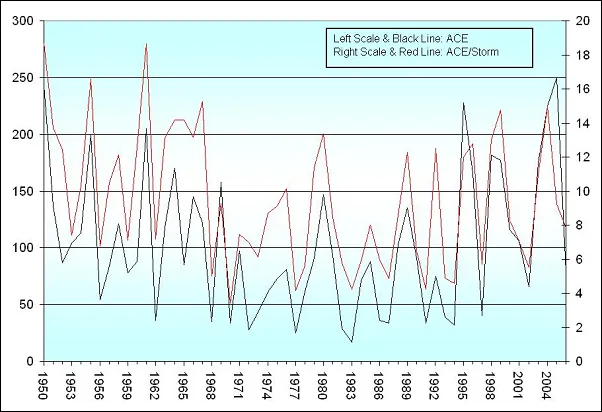
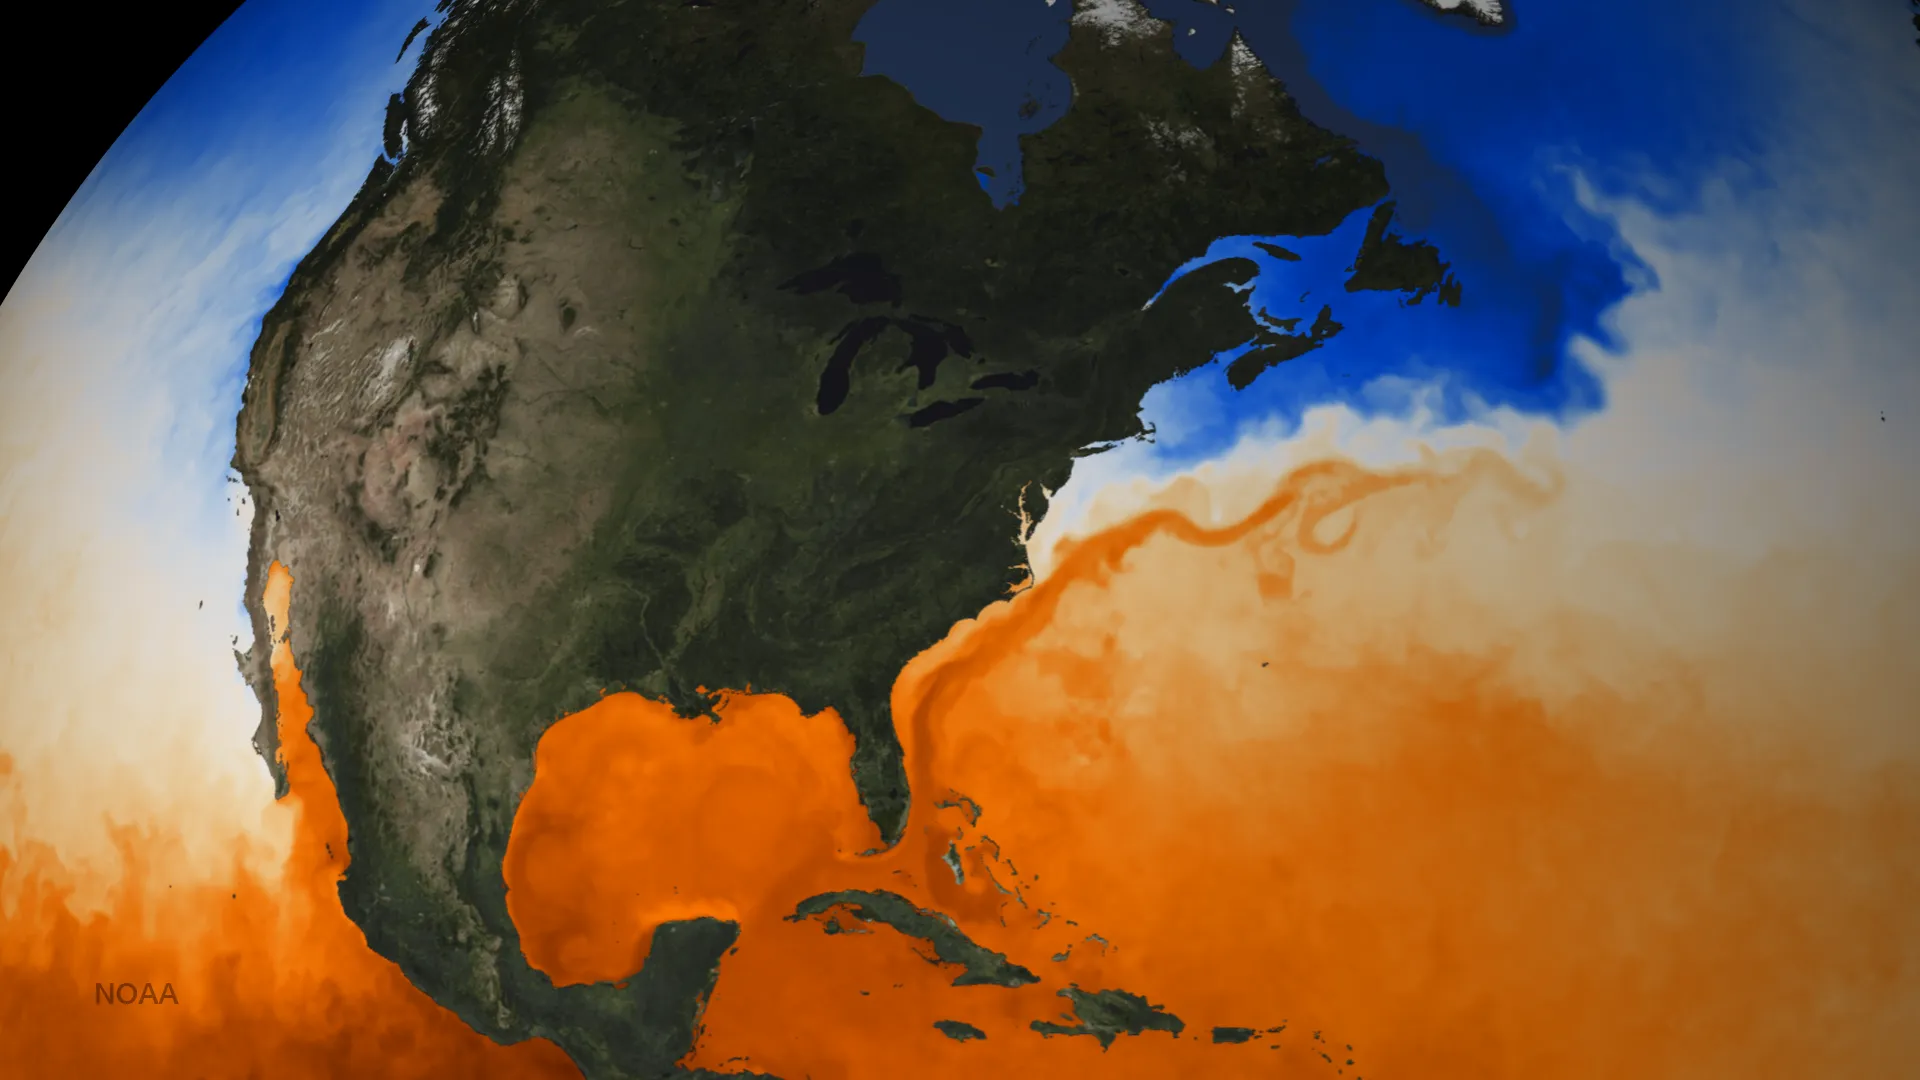
Atlantic activity varies over years and decades. Atlantic multidecadal variability reflects a combination of internal variability and external influences, including aerosols and greenhouse gases; it is not a predictable 60–80-year clock. El Niño generally increases Atlantic vertical wind shear, whereas La Niña often favors hurricane activity.2
The Observation Problem
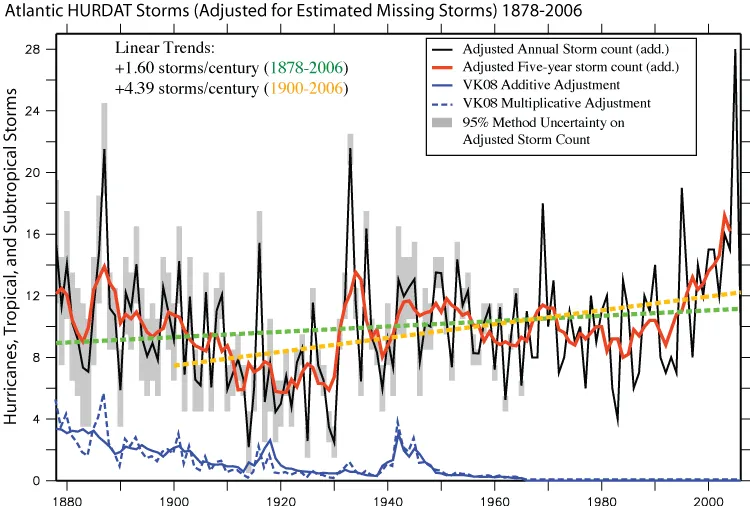
Comparing modern seasons to the distant past is fraught, because detection has improved dramatically. Before the satellite era (pre-1966), storms that stayed at sea or struck sparsely populated areas were often missed, and weak systems were undercounted.3 Apparent increases in storm counts therefore partly reflect better observation rather than more storms, a bias researchers must correct for before drawing conclusions about long-term frequency.3
Climate Change Signals
Once these factors are accounted for, the clearest climate-change signals are in intensity and rainfall, not overall frequency. The IPCC's Sixth Assessment Report concludes it is likely that the global proportion of major (Category 3–5) tropical cyclones has increased over the past four decades, and very likely that tropical-cyclone rainfall rates will rise with warming.2 Satellite analyses likewise find that the proportion of storms reaching major-hurricane intensity has grown over recent decades.4 Global tropical-cyclone frequency is projected to decrease or remain unchanged, while the proportion of very intense storms increases.2
Rapid Intensification on the Rise
One of the most consequential trends is in rapid intensification: an increase of at least 35 mph (55 km/h; 30 kt) in a storm's maximum winds within 24 hours. Bhatia and colleagues (2019) found a significant upward shift in Atlantic intensification rates between 1982 and 2009, with the fastest-strengthening storms strengthening faster than in the past.5 Rapid intensification is especially dangerous near land, because a storm can leap one or two Saffir-Simpson categories in the final day before landfall, as Michael (2018), Ida (2021), and Ian (2022) all did, leaving little time to revise warnings or evacuate.
Slower, Wetter Storms
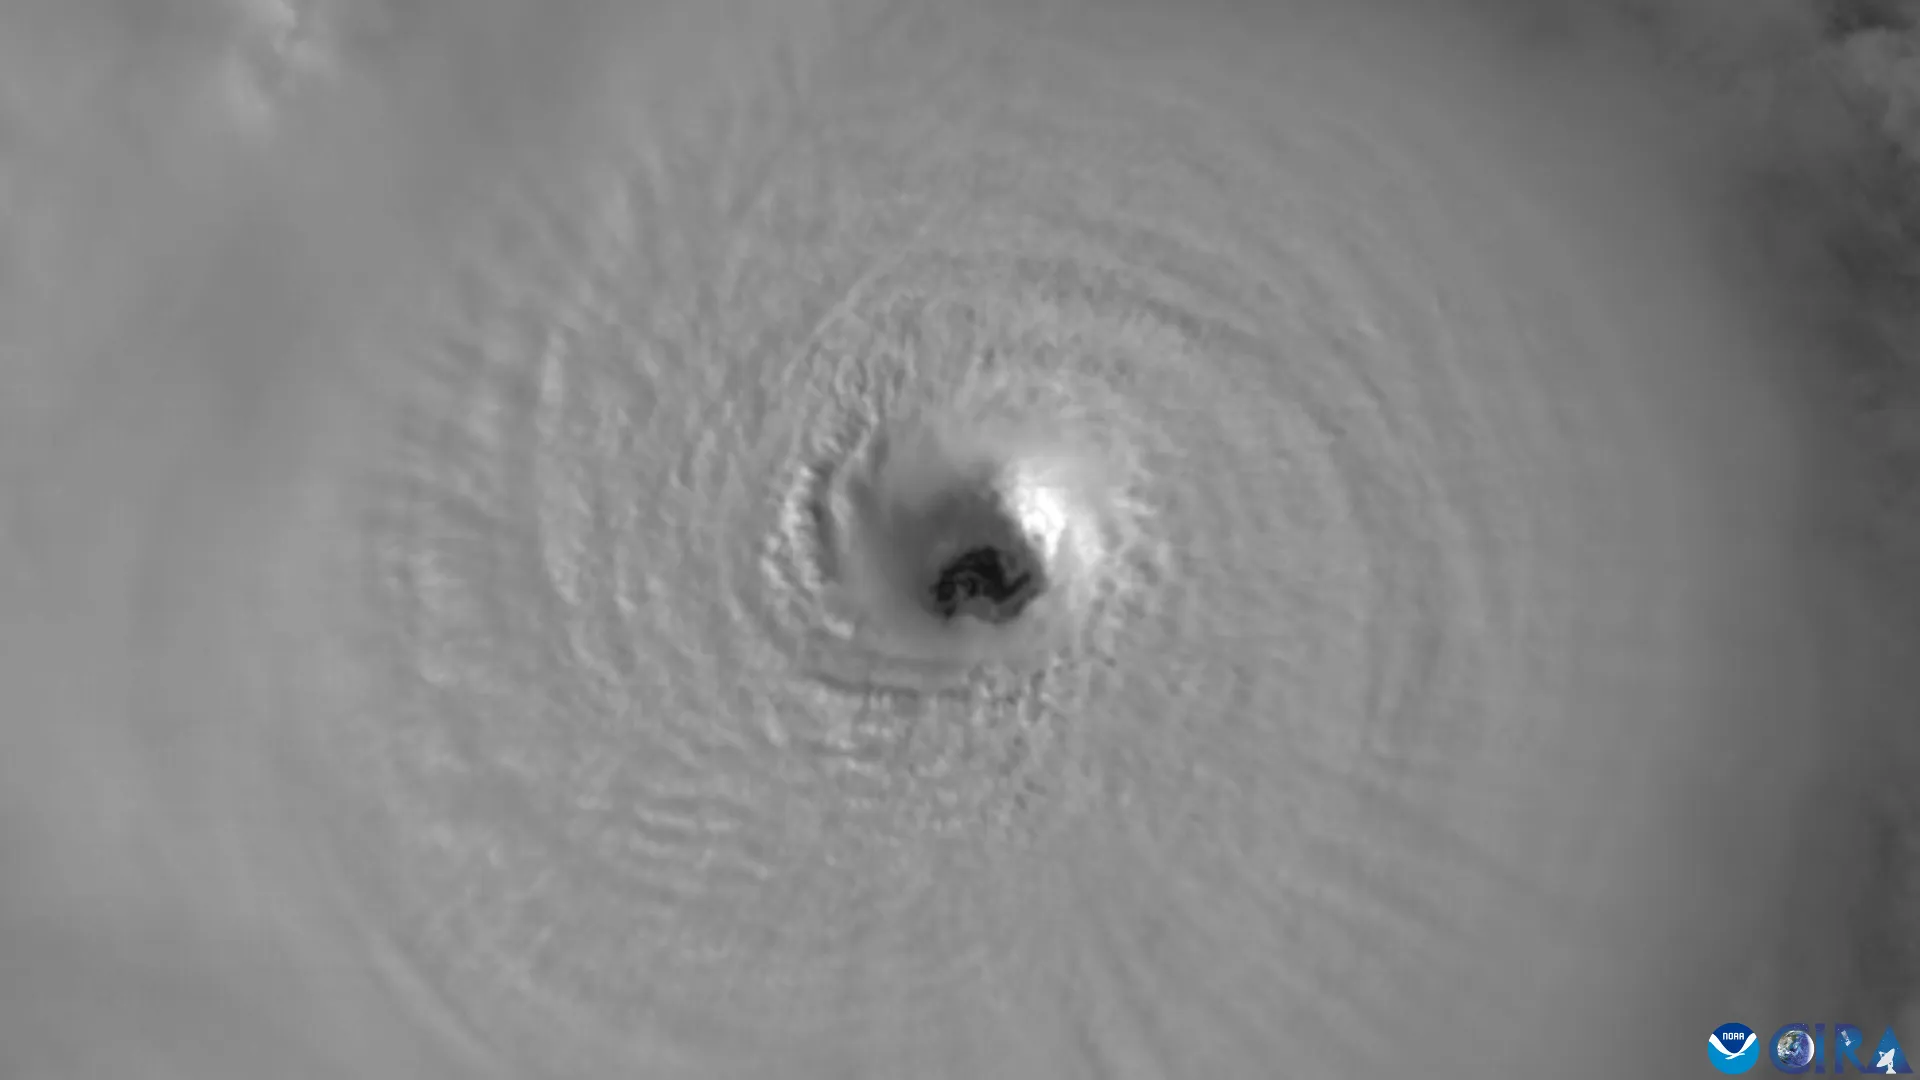
Kossin (2018) reported a roughly 10% decline in global translation speed over 1949–2016. That result should not be treated as a settled global climate-change attribution: the IPCC notes observational limitations and greater confidence in a slowdown over the contiguous United States. Slower movement can increase local rainfall accumulation. Local relative sea-level rise also increases the baseline for coastal flooding; it is not identical everywhere to the global mean.62
Reading a Single Season
Any single busy or quiet season carries less signal than the headlines suggest. Atlantic activity blends long natural cycles, year-to-year ENSO swings, an evolving observing system, and a warming climate that is making the strongest storms stronger and wetter, and pulling those threads apart is what separates a real trend from a noisy year.2 Intensity and rainfall deserve attention because they are where the physics and the observations agree most clearly; the frequency question remains genuinely unsettled, and should be described with the study’s scope and uncertainty. For how these trends translate into damage and dollars, see climate change and hurricane intensity and costliest natural disasters.
Sources
-
National Hurricane Center. Tropical Cyclone Climatology. NOAA. https://www.nhc.noaa.gov/climo/ ↩
-
Seneviratne, S. I., et al. (2021). Weather and climate extreme events in a changing climate. In Climate Change 2021: The Physical Science Basis (IPCC AR6 WG1, Ch. 11). Cambridge University Press. https://www.ipcc.ch/report/ar6/wg1/ ↩ ↩2 ↩3 ↩4 ↩5
-
Landsea, C. W., & Franklin, J. L. (2013). Atlantic hurricane database uncertainty and presentation of a new database format. Monthly Weather Review, 141(10), 3576–3592. https://doi.org/10.1175/MWR-D-12-00254.1 ↩ ↩2
-
Kossin, J. P., Knapp, K. R., Olander, T. L., & Velden, C. S. (2020). Global increase in major tropical cyclone exceedance probability over the past four decades. Proceedings of the National Academy of Sciences, 117(22), 11975–11980. https://doi.org/10.1073/pnas.1920849117 ↩
-
Bhatia, K. T., Vecchi, G. A., Knutson, T. R., et al. (2019). Recent increases in tropical cyclone intensification rates. Nature Communications, 10, 635. https://doi.org/10.1038/s41467-019-08471-z ↩
-
Kossin, J. P. (2018). A global slowdown of tropical-cyclone translation speed. Nature, 558, 104–107. https://doi.org/10.1038/s41586-018-0158-3 ↩