Reported U.S. hurricane losses reflect the storms, the people and property exposed, vulnerability, and price changes. A rising dollar series alone cannot separate their contributions.
The Billion-Dollar Record
NOAA's National Centers for Environmental Information (NCEI) tracked disasters that cause at least $1 billion in damage, measured in inflation-adjusted dollars using the Consumer Price Index (CPI). By that measure, tropical cyclones are the single costliest disaster type, accounting for the largest share of total U.S. billion-dollar losses since 1980.1 Both the number of billion-dollar disasters per decade and their combined cost have climbed steeply, with tropical cyclones contributing the heaviest individual events.1
Comparing Periods
The NCEI archive ends in 2024. A reproducible decade comparison requires an identified dataset version and price year, explicit event filters, and equal-length periods or annualized values. The 1980–2024 archive contains 67 billion-dollar tropical-cyclone events, including tropical storms as well as hurricanes.1
The Costliest Storms
For individually sourced estimates, see Katrina, Harvey, Ian, and Maria. Their original-dollar estimates use different price years and must not be read as an inflation-adjusted ranking.
What Is Driving Rising Damage Costs
It is tempting to read a rising loss record as a direct measure of how much hurricanes themselves have worsened, but those are two separate questions. The dominant driver of rising hurricane costs is exposure: more people, more buildings, and more valuable property along vulnerable coasts.
Normalization is central to this question. To normalize a historical loss, you take an old storm and estimate what it would cost against today's population, wealth, and building stock. When the record is normalized consistently for inflation, population, and wealth, the long-term upward trend in U.S. hurricane damage largely flattens. That result points to societal change, rather than a clear damage trend in the storms, as the main explanation for the rise in losses.2
A normalized loss study is not an attribution analysis of every recent event. Climate-related changes in rainfall, intensity and sea level can affect damage, but the cited series does not quantify a universal “marginal” contribution.
Reading the Numbers Carefully
Inflation adjustment and loss normalization are distinct. NCEI adjusts prices with CPI; the cited normalization study additionally adjusts exposure and wealth. Use a common price year to compare purchasing power, and a clearly defined normalization method to explore changes in exposure.
The record also has boundaries worth stating plainly. It counts only events that cross the $1 billion threshold, so it captures nothing about the far larger number of smaller disasters. It measures property and economic loss, which is not the same as human cost: a storm that erases a modest community can rank below one that damages expensive real estate.
Deaths Versus Dollars
Monetary losses and mortality measure different consequences. Revised NHC counts include 1,392 deaths for Katrina and an estimated 2,975 for Maria in Puerto Rico. Death counts also differ in their treatment of indirect effects, so comparisons require explicit definitions.
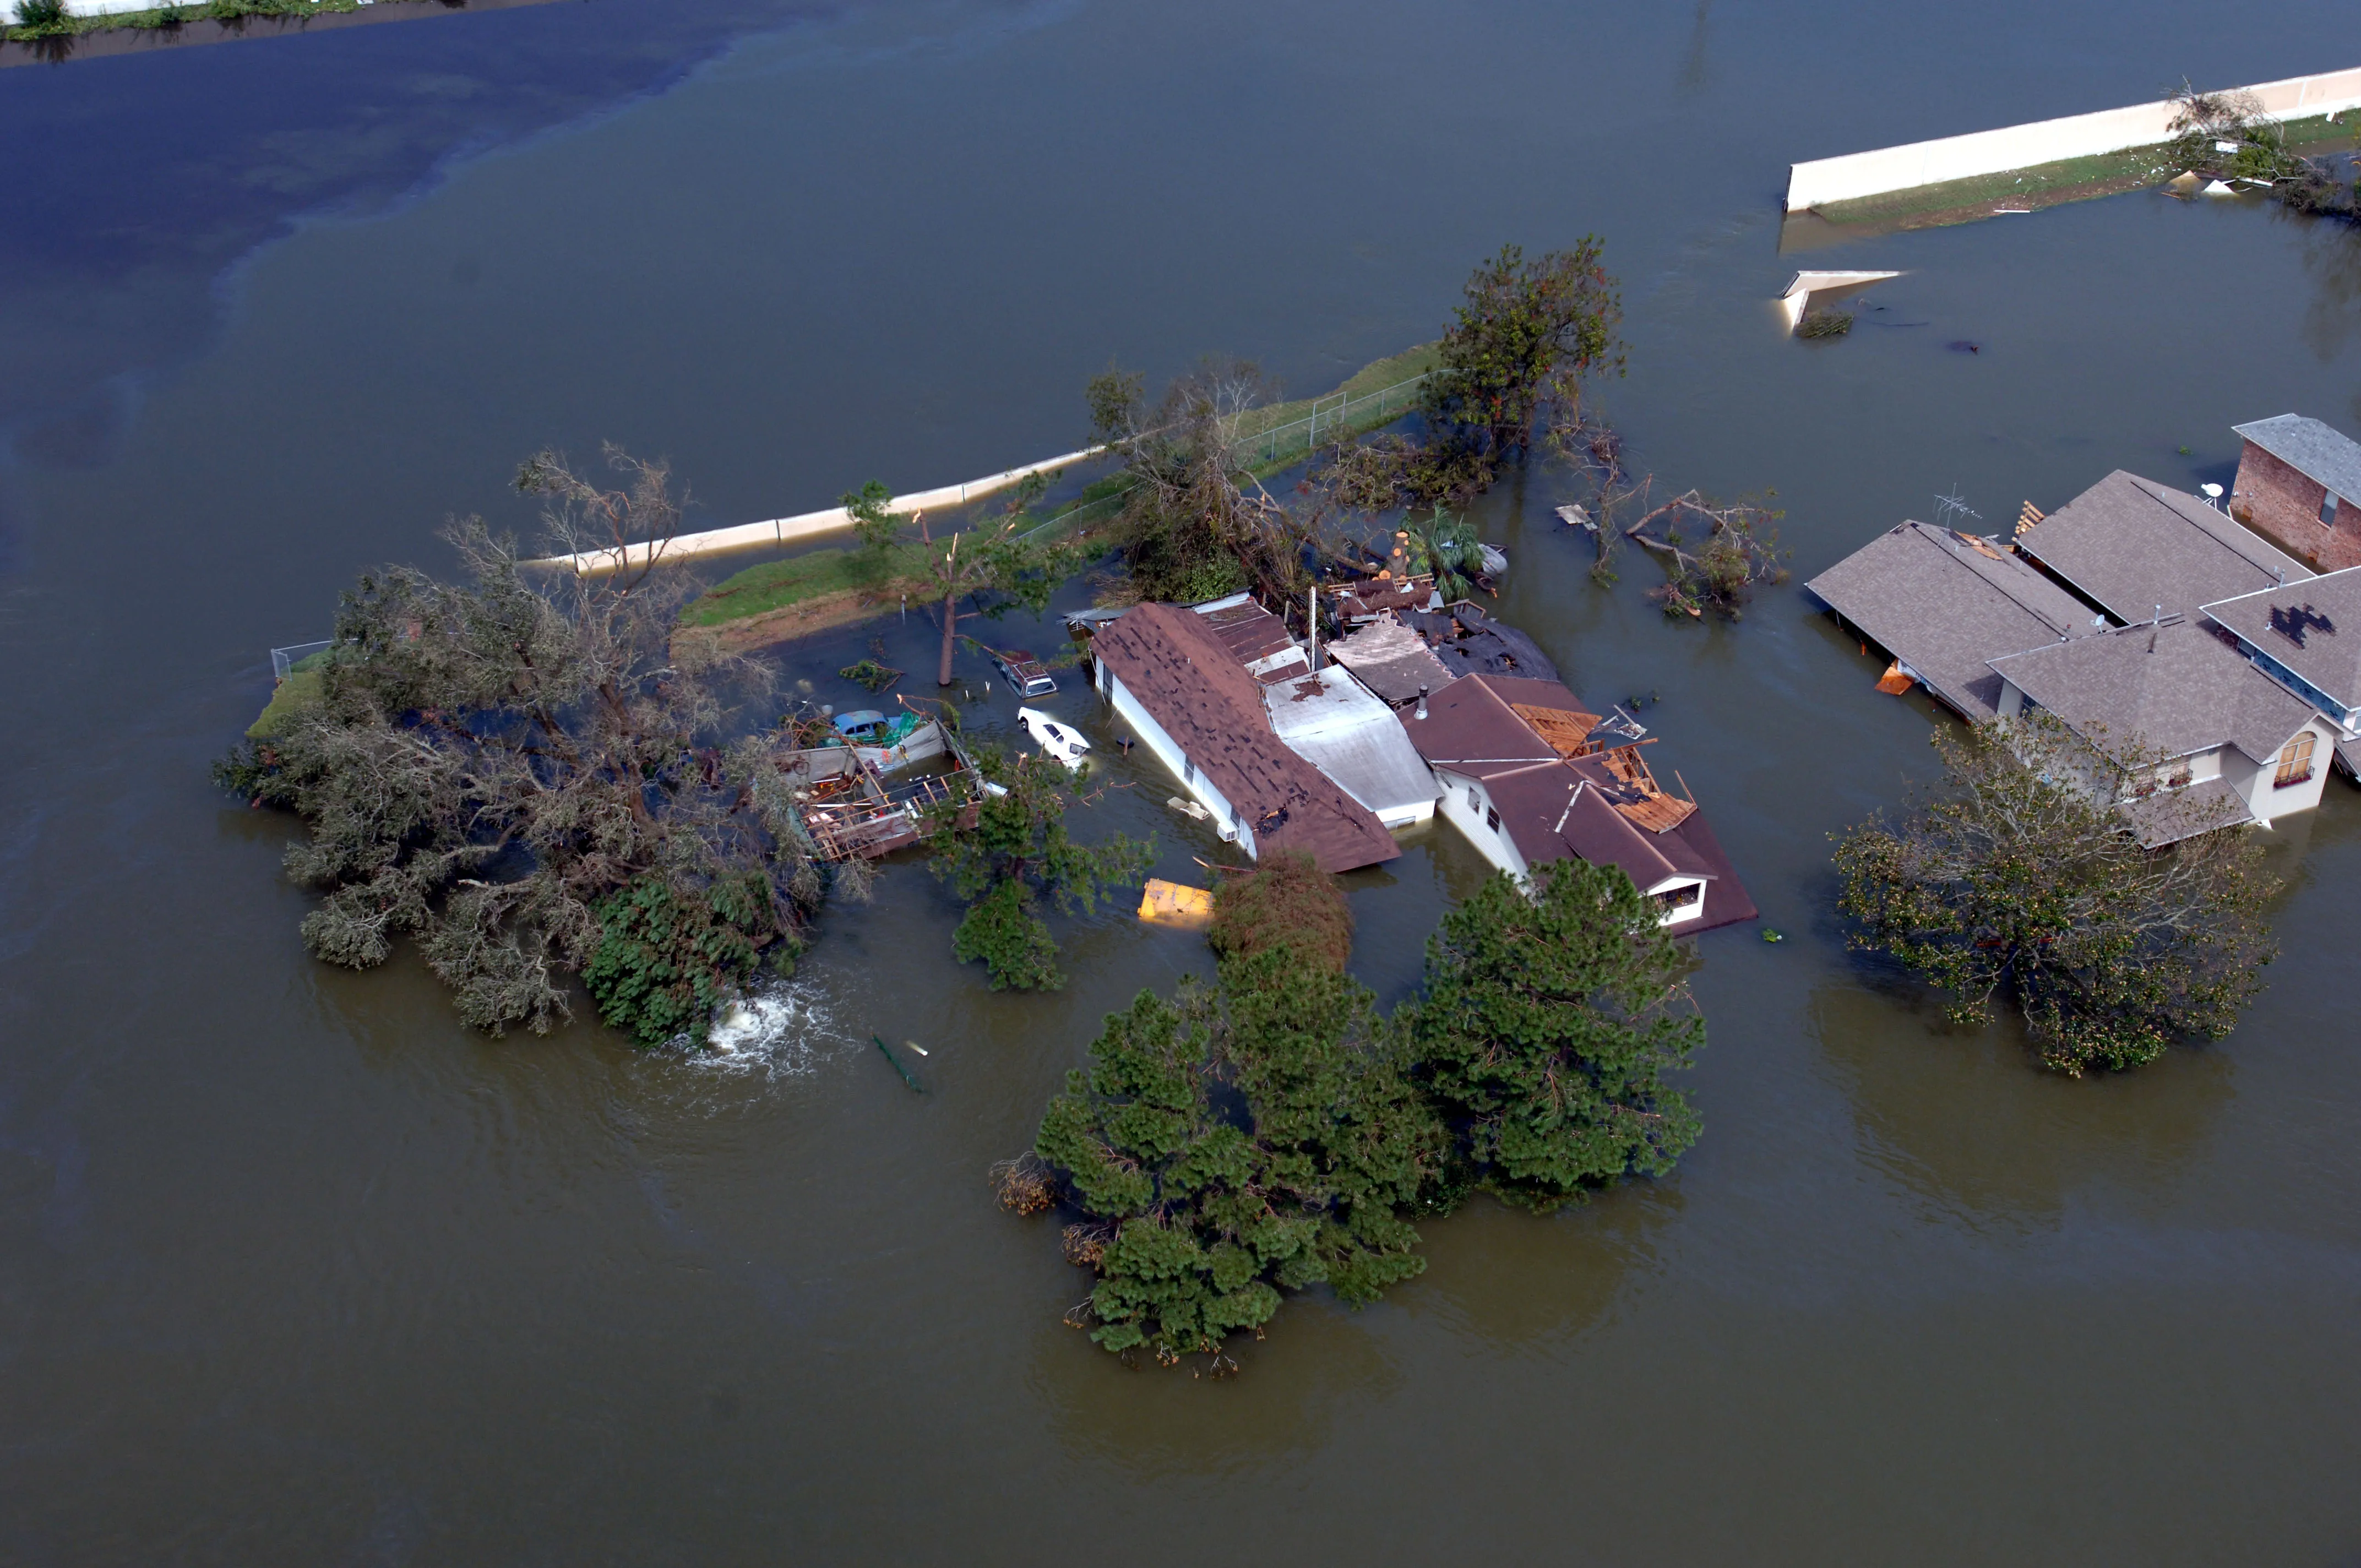
What Actually Reduces the Losses
Building standards, land-use decisions, flood defenses, warnings, evacuation and insurance serve different roles. Insurance finances covered losses; it does not physically prevent damage. Which measures work best depends on local hazards and exposure. See hurricane-resistant construction.
Sources
-
NOAA National Centers for Environmental Information. U.S. Billion-Dollar Weather and Climate Disasters. https://www.ncei.noaa.gov/access/billions/ (DOI: 10.25921/stkw-7w73) ↩ ↩2 ↩3
-
Weinkle, J., Landsea, C., Collins, D., Musulin, R., Crompton, R. P., Klotzbach, P. J., & Pielke, R. (2018). Normalized hurricane damage in the continental United States 1900–2017. Nature Sustainability, 1, 808–813. https://doi.org/10.1038/s41893-018-0165-2 ↩