KEY FACTS: Peak intensity: Category 5, 175 mph (280 km/h) winds over the Gulf; Landfall: Cat 3 near Buras, Louisiana; Peak storm surge: 28 ft (8.5 m) on the Mississippi coast; Deaths: ~1,392; Damage: $125 billion (2005 dollars); Date: August 29, 2005
Meteorological History
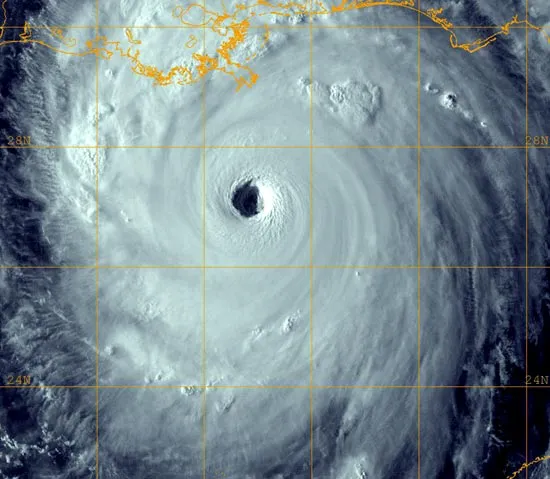
Hurricane Katrina formed on August 23, 2005, from a tropical wave near the Bahamas. The initial system was relatively weak, but as it moved westward across the warm waters of the Atlantic and entered the Gulf of Mexico, conditions became ideal for explosive development. The Gulf's surface temperatures exceeded 84°F (29°C), and atmospheric wind shear was minimal, a setting well suited to rapid intensification.
By August 28, Katrina reached Category 5, with sustained winds of 175 mph (280 km/h) and a minimum pressure of 902 mb. Its eyewall changed substantially before landfall; imagery alone cannot establish that it reached its theoretical maximum intensity.1
The Approach and Weakening
Katrina weakened to Category 3 before its Louisiana landfall. The NHC identifies internal structural changes as the primary explanation, while noting possible contributions from dry air, shear, and slightly cooler water. Its broad wind field still generated devastating surge; a wind category does not describe that hazard.1
Landfall & Impact
Katrina made landfall near Buras at 6:10 a.m. CDT (1110 UTC) on August 29, with estimated sustained winds of 125 mph. It later crossed the Louisiana–Mississippi border at Category 3 intensity. Surge reached roughly 24–28 feet along parts of the Mississippi coast; these coastal values should not be presented as water levels at New Orleans canal failures.1
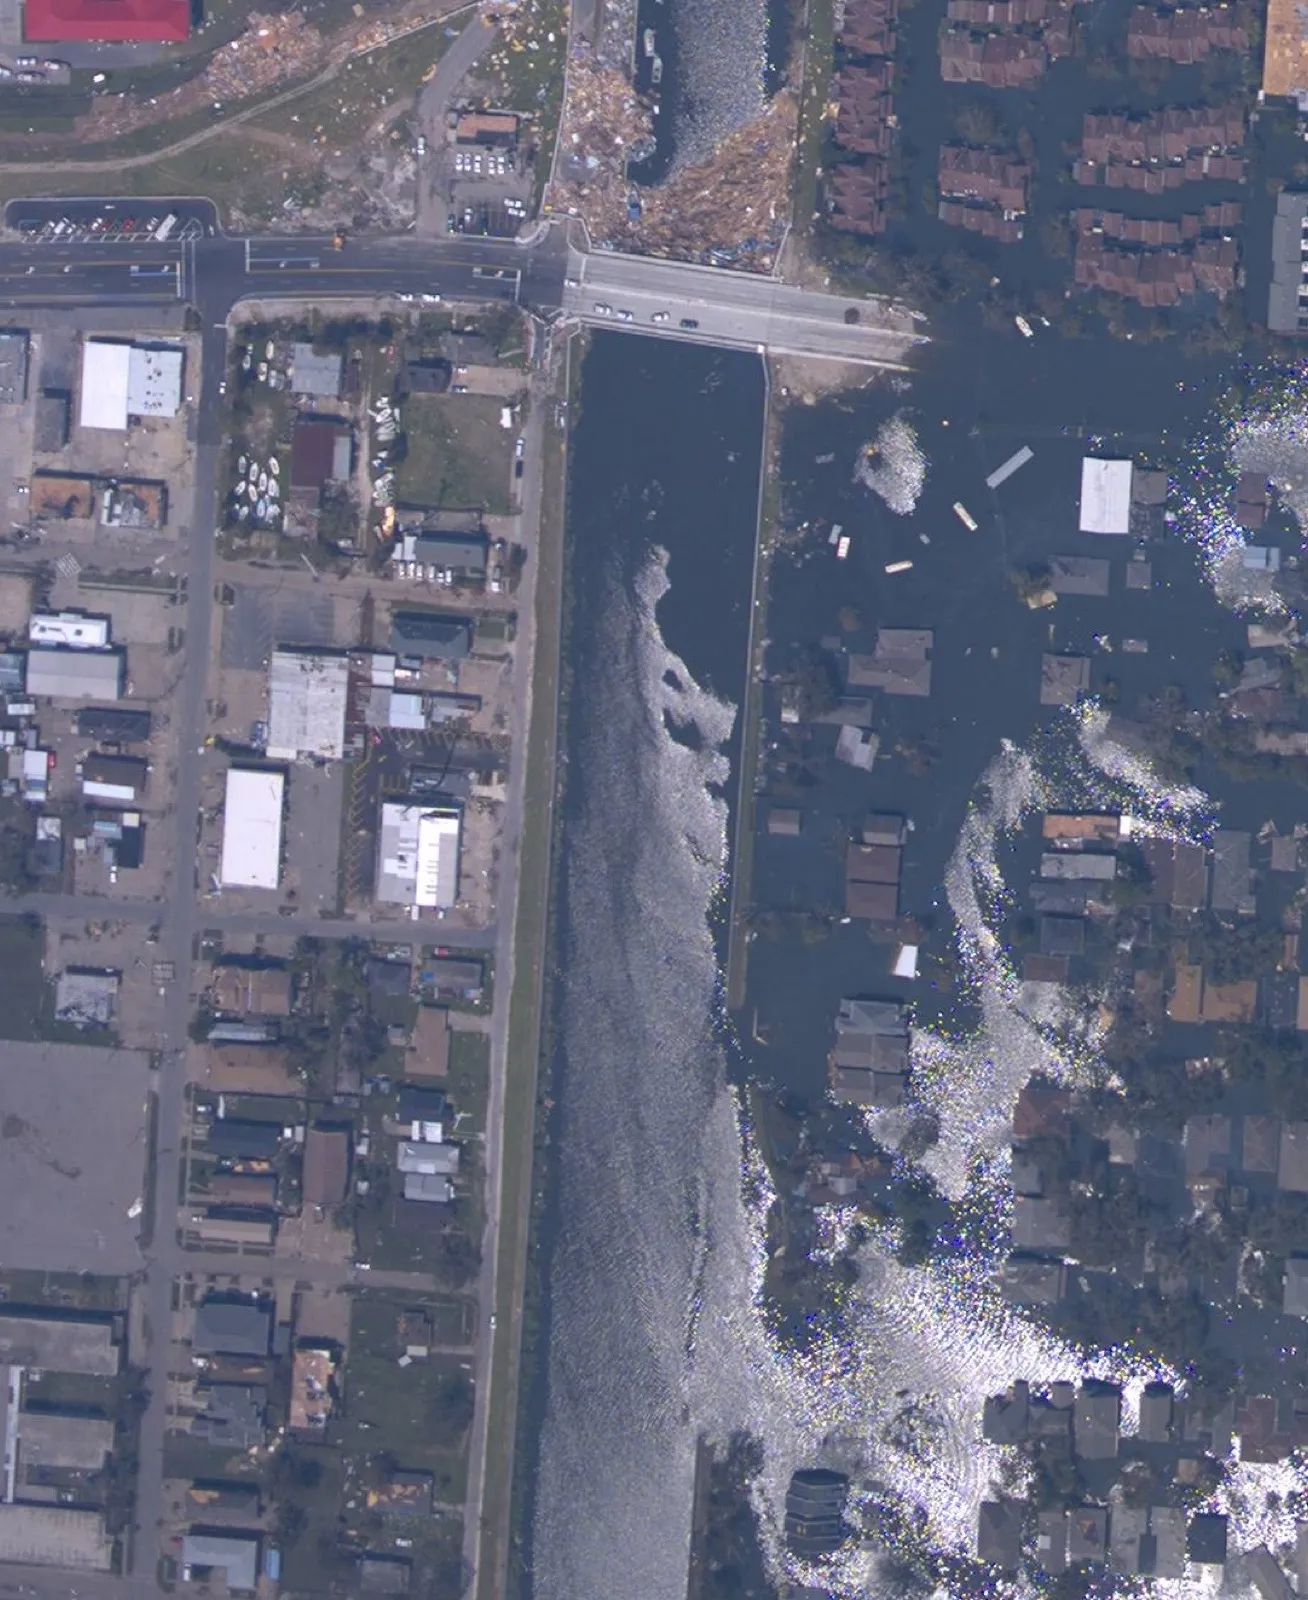
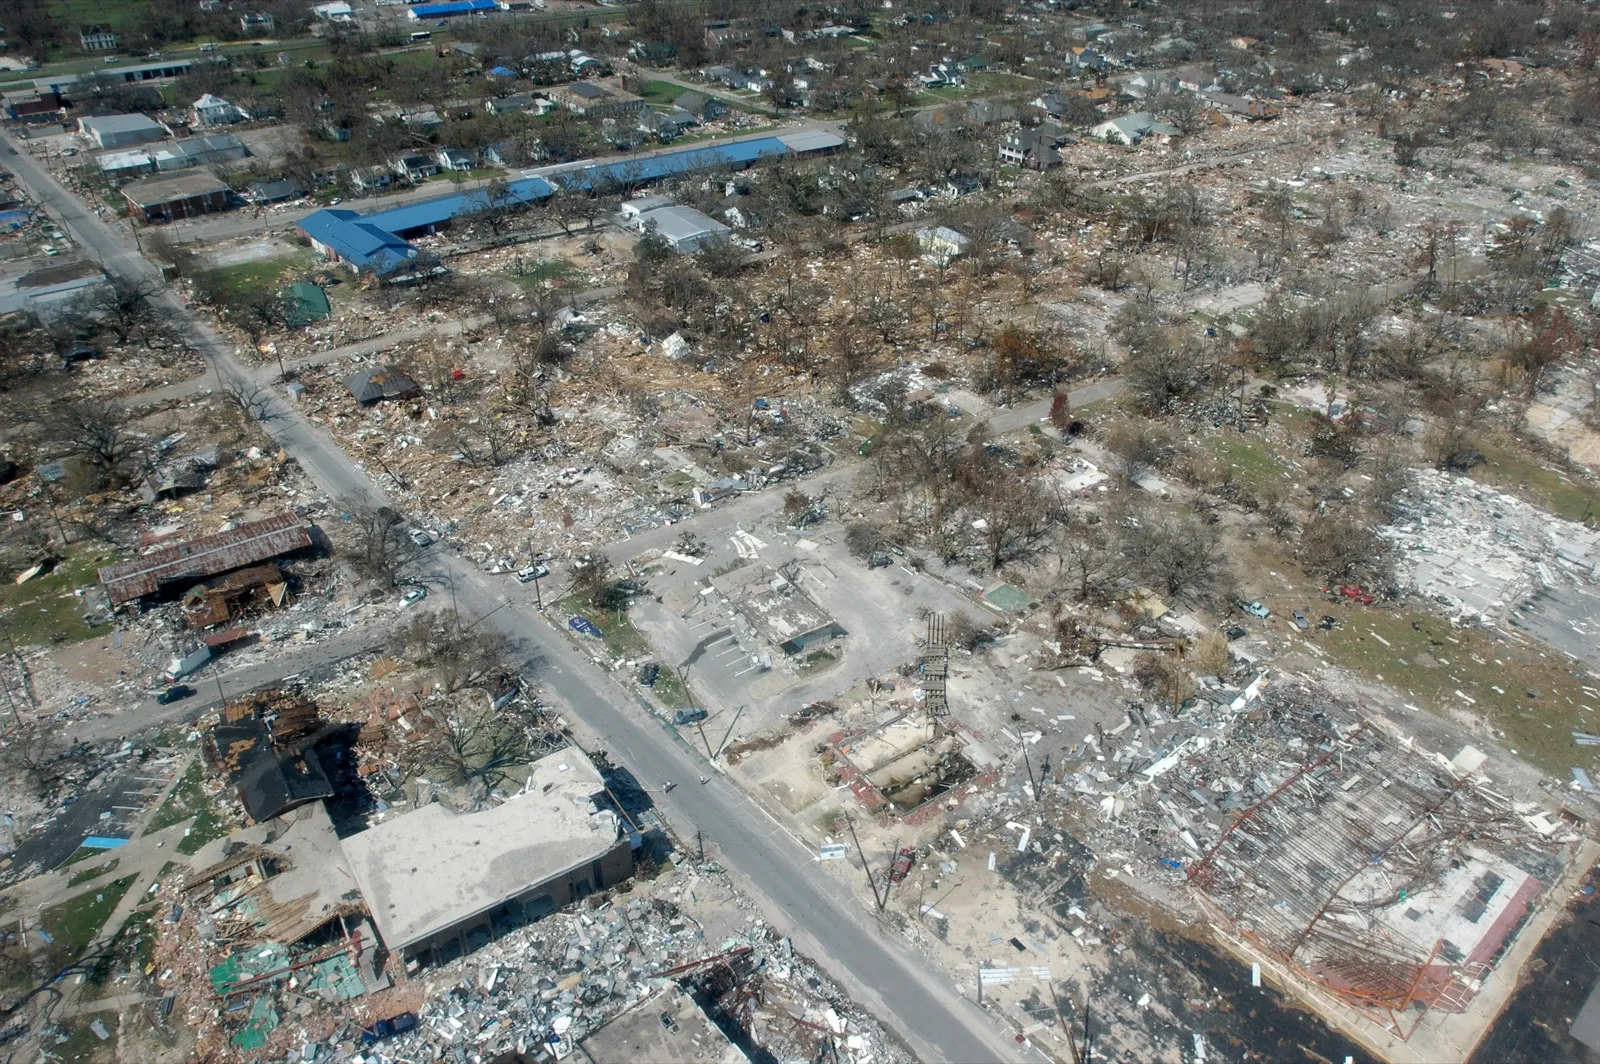
Flooding in New Orleans followed multiple levee and floodwall breaches. The 17th Street and London Avenue canals are separate waterways, not intersecting canals. Investigators found foundation failures at some sites before water overtopped the walls; elsewhere overtopping and erosion contributed. About 80% of New Orleans flooded.12
The different failure mechanisms matter for repairs: raising a wall does not by itself correct a weak foundation. The post-Katrina investigations examined both hydraulic loads and the performance of soils and structures.2
Infrastructure Collapse
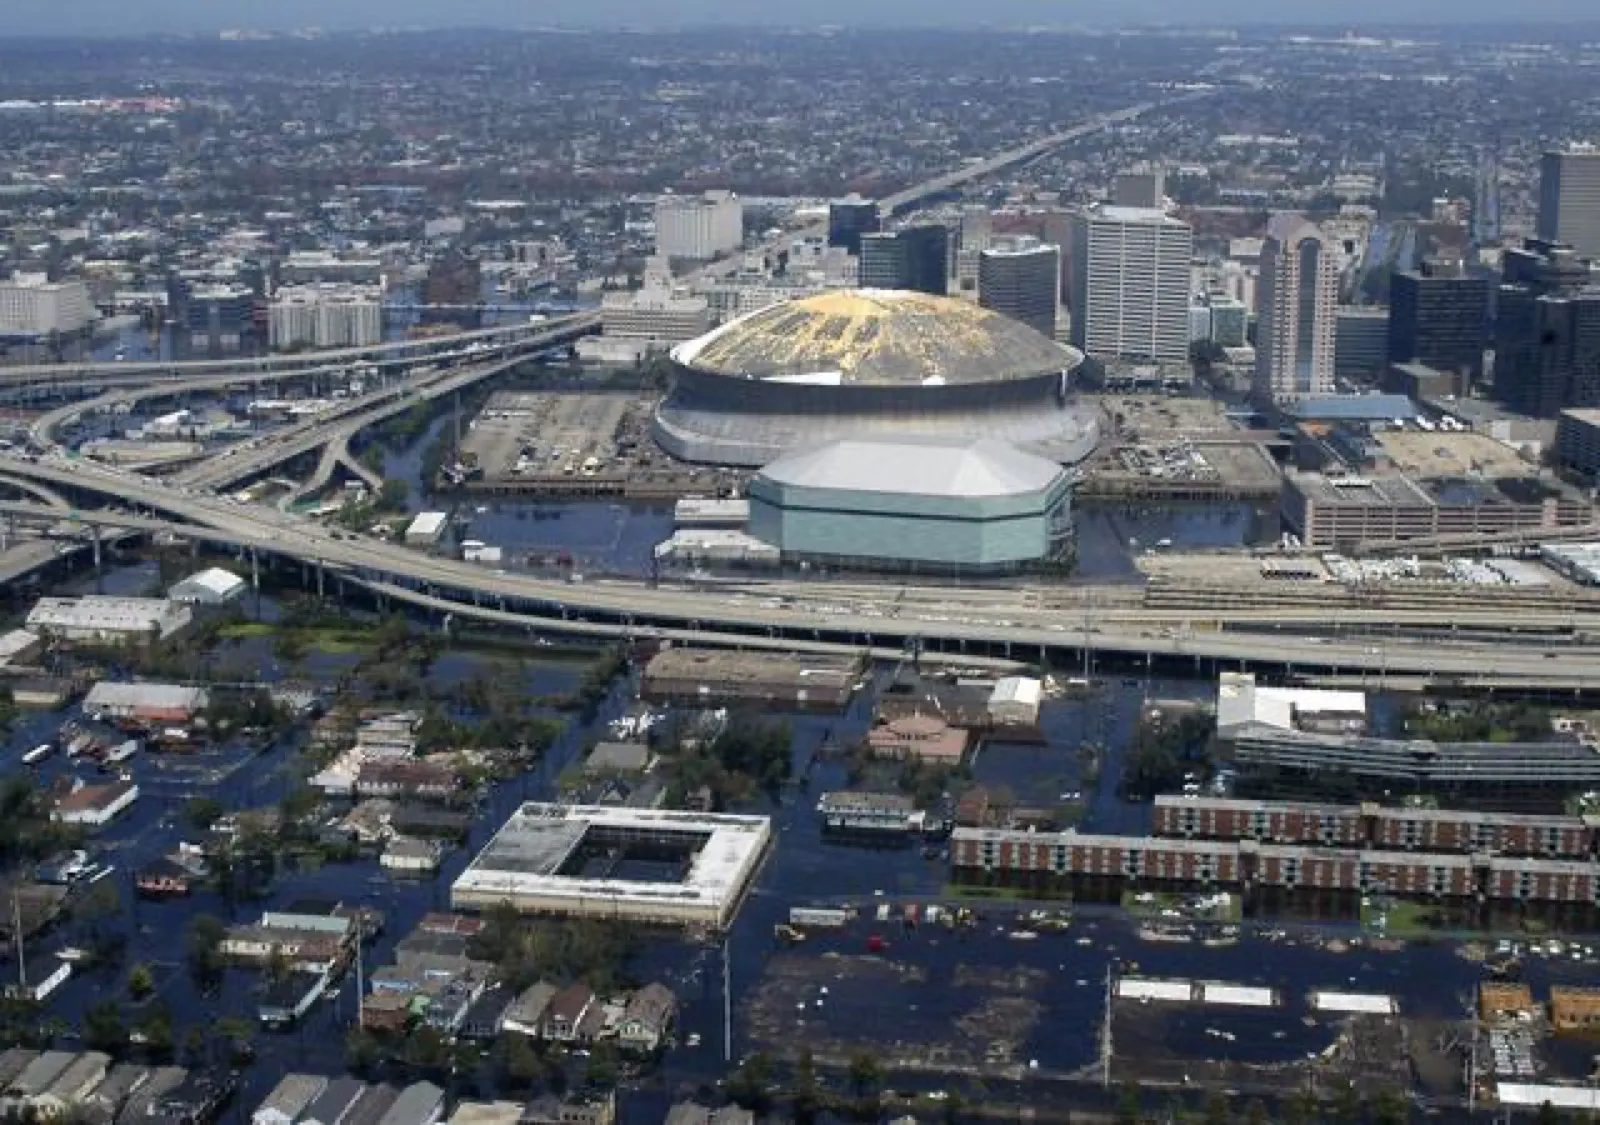
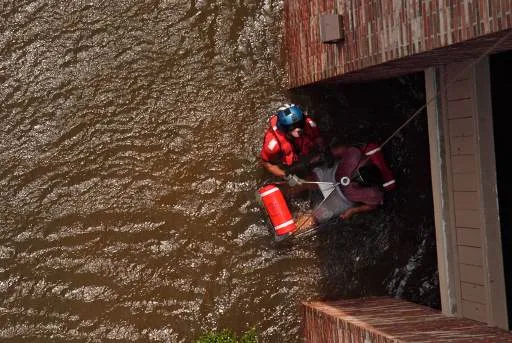
The flooding spread rapidly through the city's wards, trapping thousands of residents who had stayed behind or lacked means to evacuate. The water was contaminated with sewage, industrial chemicals, and hazardous materials, creating a public health nightmare. Power failed across the region, hospitals lost functionality, and the water treatment system collapsed. Rescue operations became some of the most harrowing in American history, with Coast Guard helicopters plucking people from rooftops, attics, and improvised rafts for weeks after the storm's passage.
Human Toll & Mortality
The revised NHC report lists 1,392 fatalities: 520 direct, 565 indirect, and 307 of indeterminate cause. The total already includes indirect deaths; older counts above 1,800 reflect earlier assessments.1
Age, health, housing and access to evacuation resources affected vulnerability. Studies of mortality and displacement use different populations and measures; neighborhood damage should not be treated as a direct measure of an individual’s risk.3
Displacement and Long-Term Effects
Katrina displaced people across the Gulf Coast, and many New Orleans residents could not return promptly. Housing damage, employment, health and access to services affected recovery and relocation.
Economic Impact
Hurricane Katrina caused $125 billion in damage (2005 dollars), making it the costliest hurricane in U.S. history and one of the costliest natural disasters globally.4 Losses included residential destruction, commercial property damage, infrastructure failure, loss of productive capacity, and long-term economic disruption. The Port of New Orleans, one of the nation's busiest ports, suffered severe damage and disruption to cargo operations. Refineries and petrochemical facilities along the coast were damaged or shut down, causing temporary spikes in fuel prices nationwide.
Damage estimates and insured-loss estimates cover different things. Comparing them requires matching their year, geography, and definitions; subtracting a differently based insurance figure does not produce a reliable uninsured-loss estimate.
Government Response & Policy Failures
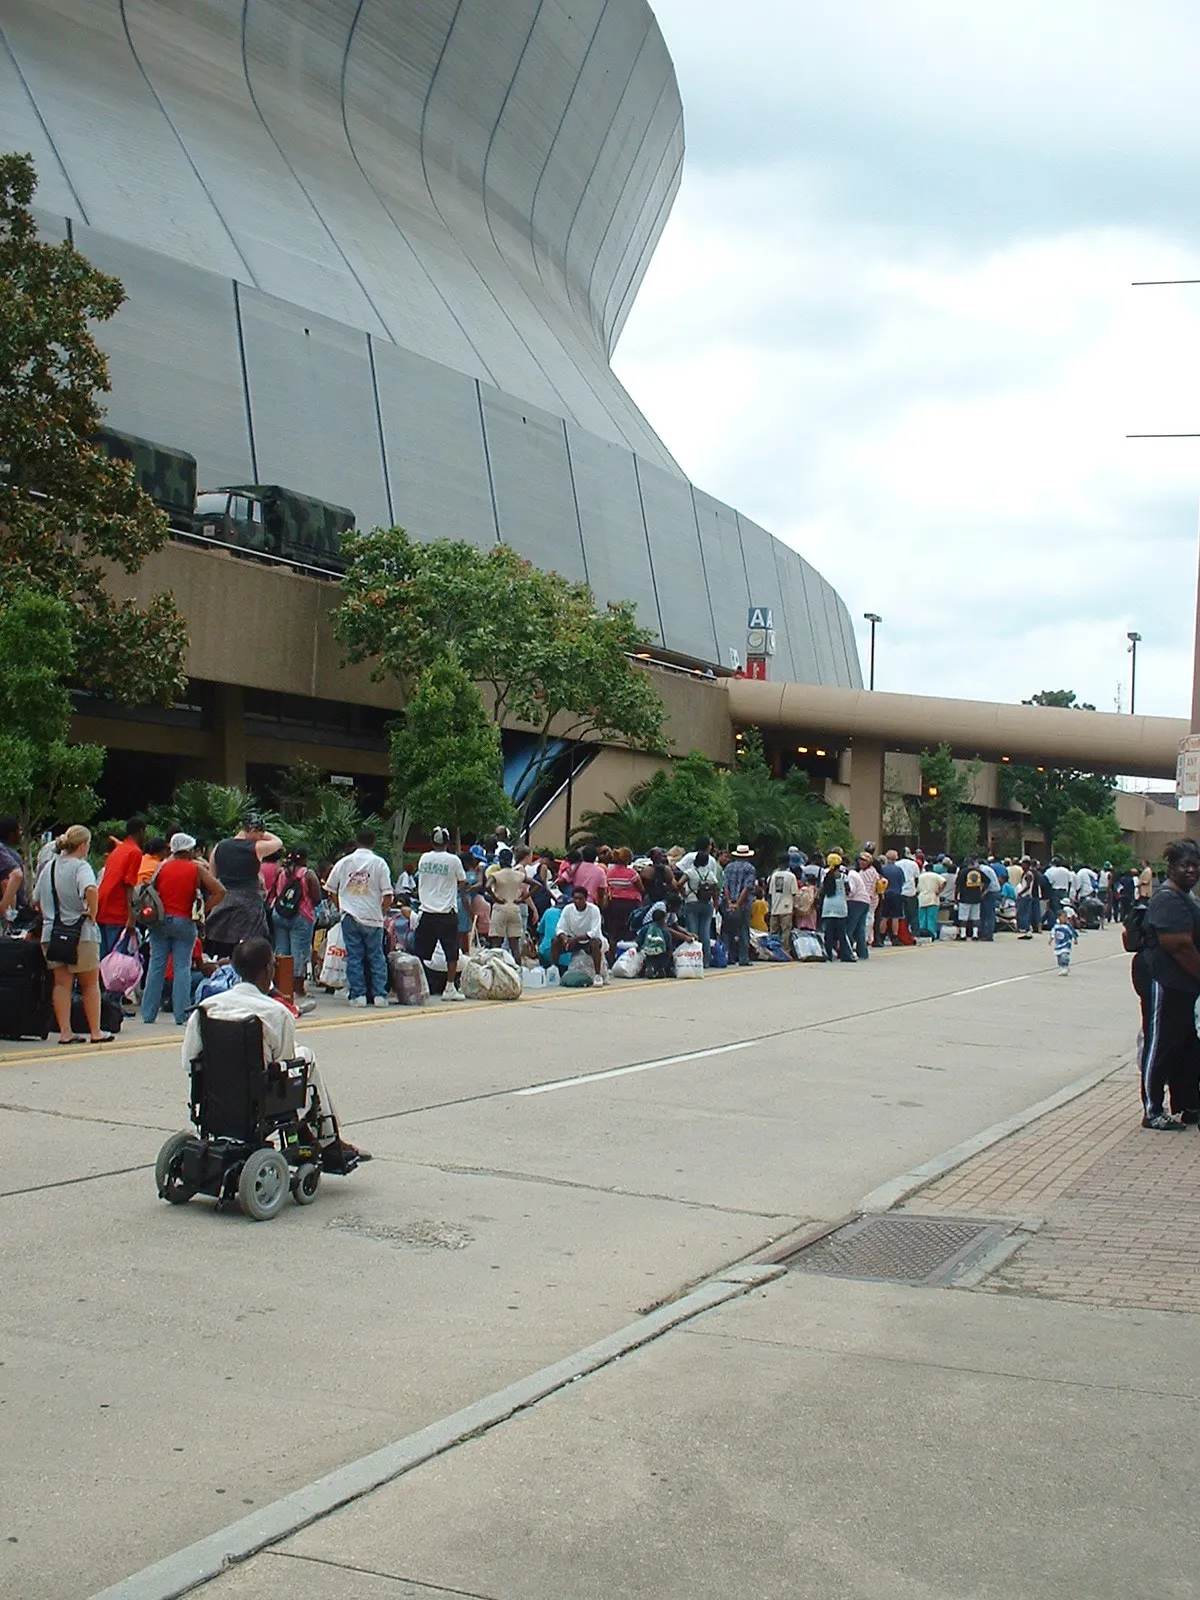
The House investigation documented serious failures in preparation, communication, coordination, and assistance. Conditions at the Superdome and Convention Center deteriorated as evacuees waited for transport and supplies. They were not detention centers, and early reports of violence should not be repeated without verification.5
The House Select Bipartisan Committee published A Failure of Initiative in 2006. This was not a “9/11 Commission-style Hurricane Katrina Commission.” Congress subsequently enacted reforms to emergency management.5
Levee System Reform
The levee failures sparked an unprecedented engineering and policy response. The U.S. Army Corps of Engineers conducted comprehensive post-flood investigations and identified multiple deficiencies in design, construction, and maintenance. Congress authorized the Hurricane and Storm Damage Risk Reduction System (HSDRRS), appropriating over $14 billion for levee improvements, pump station upgrades, and coastal protection measures. Debates continue about the adequacy of New Orleans' protection systems and the future viability of the city.
Legacy & Lessons Learned
Hurricane Katrina fundamentally changed how America thought about natural disasters, equity, and government responsibility. It exposed the reality that disaster vulnerability is not random but concentrated among the poor, elderly, and disabled. The storm also demonstrated that major American cities could be severely damaged or depopulated by a single hurricane, reshaping national discussions about climate risk and coastal development.
The NHC report describes successful forecasts alongside the catastrophic outcome. Forecast accuracy alone cannot ensure that people have transport, shelter, medical support, or functioning flood protection.1
Climate Change Implications
Katrina occurred in an era when climate change was becoming central to scientific discussions. The storm's rapid intensification in warm Gulf waters raised questions about whether warming oceans would increase the frequency and intensity of major hurricanes. Two decades later, the evidence points toward a rising proportion of the most intense hurricanes and greater rainfall potential in a warming world. Katrina reads today as an early marker of that shift, and as the storm against which the country still measures both its levees and its disaster response. For where it sits among the deadliest and costliest storms, and for how the federal aid system it reshaped now works, see government aid after a hurricane.
Sources
-
Knabb, R. D., Rhome, J. R., & Brown, D. P. (2005). Tropical Cyclone Report: Hurricane Katrina. National Hurricane Center. https://www.nhc.noaa.gov/data/tcr/AL122005_Katrina.pdf ↩ ↩2 ↩3 ↩4 ↩5 ↩6 ↩7
-
U.S. Army Corps of Engineers. Investigation of the 17th Street Canal failure. https://www.mvn.usace.army.mil/portals/56/docs/hsdrrs/MOWL-17th-St-Canal.pdf ↩ ↩2
-
Brunkard, J., Namulanda, G., & Ratard, R. (2008). Hurricane Katrina deaths, Louisiana, 2005. Disaster Medicine and Public Health Preparedness, 2(4), 215–223. https://doi.org/10.1097/DMP.0b013e31818aaf55 ↩
-
Smith, A. B. (2024). U.S. Billion-Dollar Weather and Climate Disasters. NOAA National Centers for Environmental Information. https://doi.org/10.25921/stkw-7w73 ↩
-
U.S. House of Representatives. (2006). A Failure of Initiative: Final Report of the Select Bipartisan Committee to Investigate the Preparation for and Response to Hurricane Katrina. U.S. Government Printing Office. https://www.govinfo.gov/app/details/CRPT-109hrpt377/CRPT-109hrpt377 ↩ ↩2