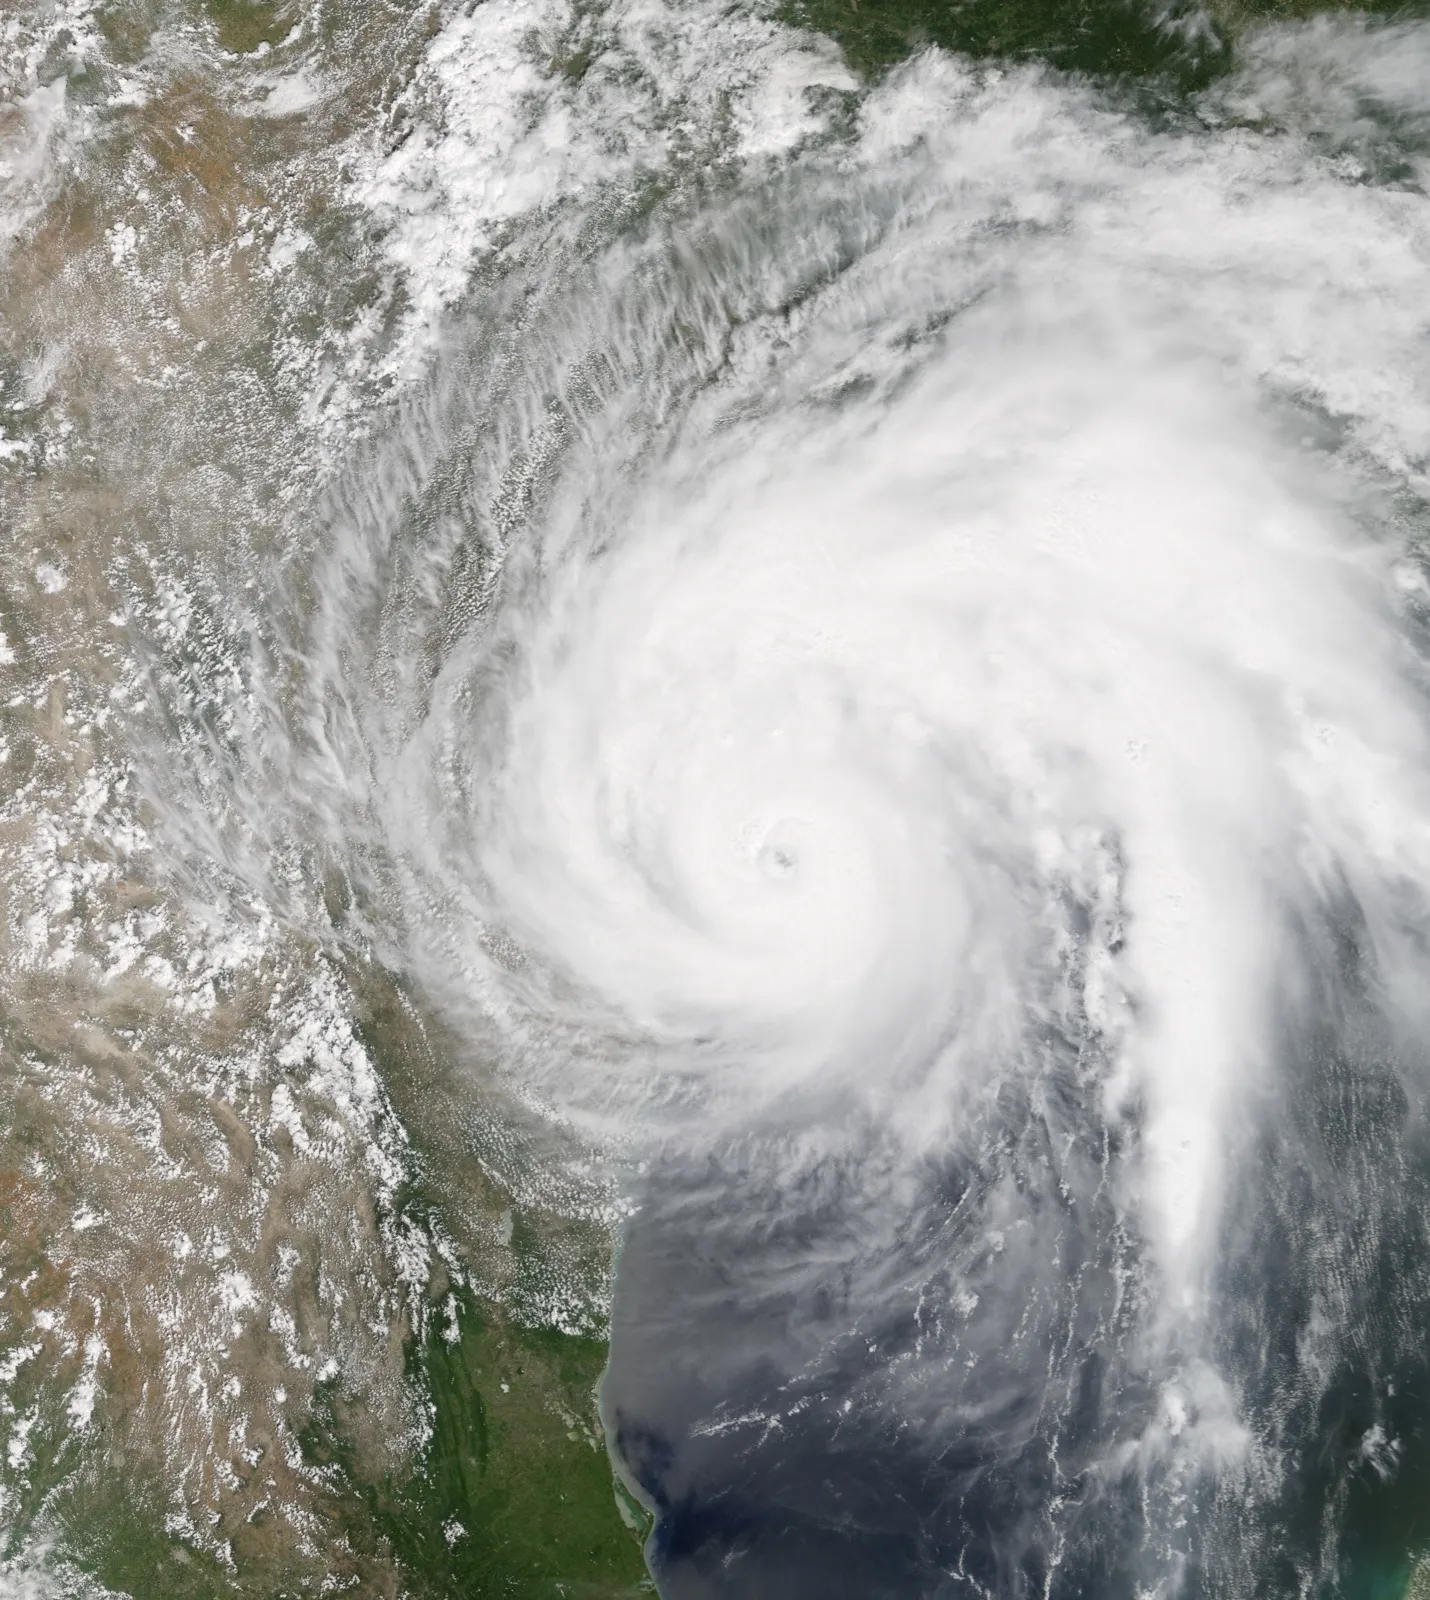
Hurricane Harvey, which struck Texas in late August 2017, fundamentally changed our understanding of hurricane risk in the modern climate. While it made landfall as a Category 4 storm with 130 mph (209 km/h) winds, the defining characteristic of Harvey was not destructive wind but catastrophic rainfall. The storm moved slowly over and near southeastern Texas, delivering unprecedented precipitation: some areas received 60.58 in (1,539 mm) of rainfall, more than Houston's average annual rainfall.1 That deluge caused $125 billion in U.S. damage (2017 dollars) 2 making Harvey one of the costliest hurricanes on record. The storm claimed 68 direct deaths1 and, like Florence a year later, showed that a hurricane's category can say little about its deadliest hazard.
Meteorological History
Hurricane Harvey originated from a tropical wave that emerged off the coast of Africa in early August 2017. The system tracked westward across the Atlantic, first becoming a tropical storm east of the Lesser Antilles on August 17. As the system moved westward and then northwestward, it encountered increasingly warm Gulf of Mexico waters, with sea-surface temperatures near 88°F (31°C), and low wind shear, conditions well suited to rapid intensification.
Harvey intensified dramatically as it crossed the Gulf. By August 25, as it approached the Texas coast, the hurricane had reached Category 4 status with maximum sustained winds of 130 mph (209 km/h) and a minimum central pressure of 937 mb.1 The storm's structure was impressive: a well-defined eye 19 mi (30 km) in diameter surrounded by an intense eyewall with deep convection extending outward in bands. Satellite appearance alone cannot establish a storm’s theoretical maximum intensity.
Atmospheric Setup for Extreme Rainfall
What made Harvey catastrophic was moisture transport rather than the wind field. Warm Gulf water, deep tropical moisture, and a weak steering current combined to produce a rainfall catastrophe. Where a typical hurricane moves northward and exits a region, Harvey stalled: a high-pressure system over the Gulf states and a mid-latitude trough left the hurricane nearly stationary over southeast Texas for days. Harvey weakened after landfall; it did not remain a Category 4 during the prolonged inland rainfall.
Landfall & Impact
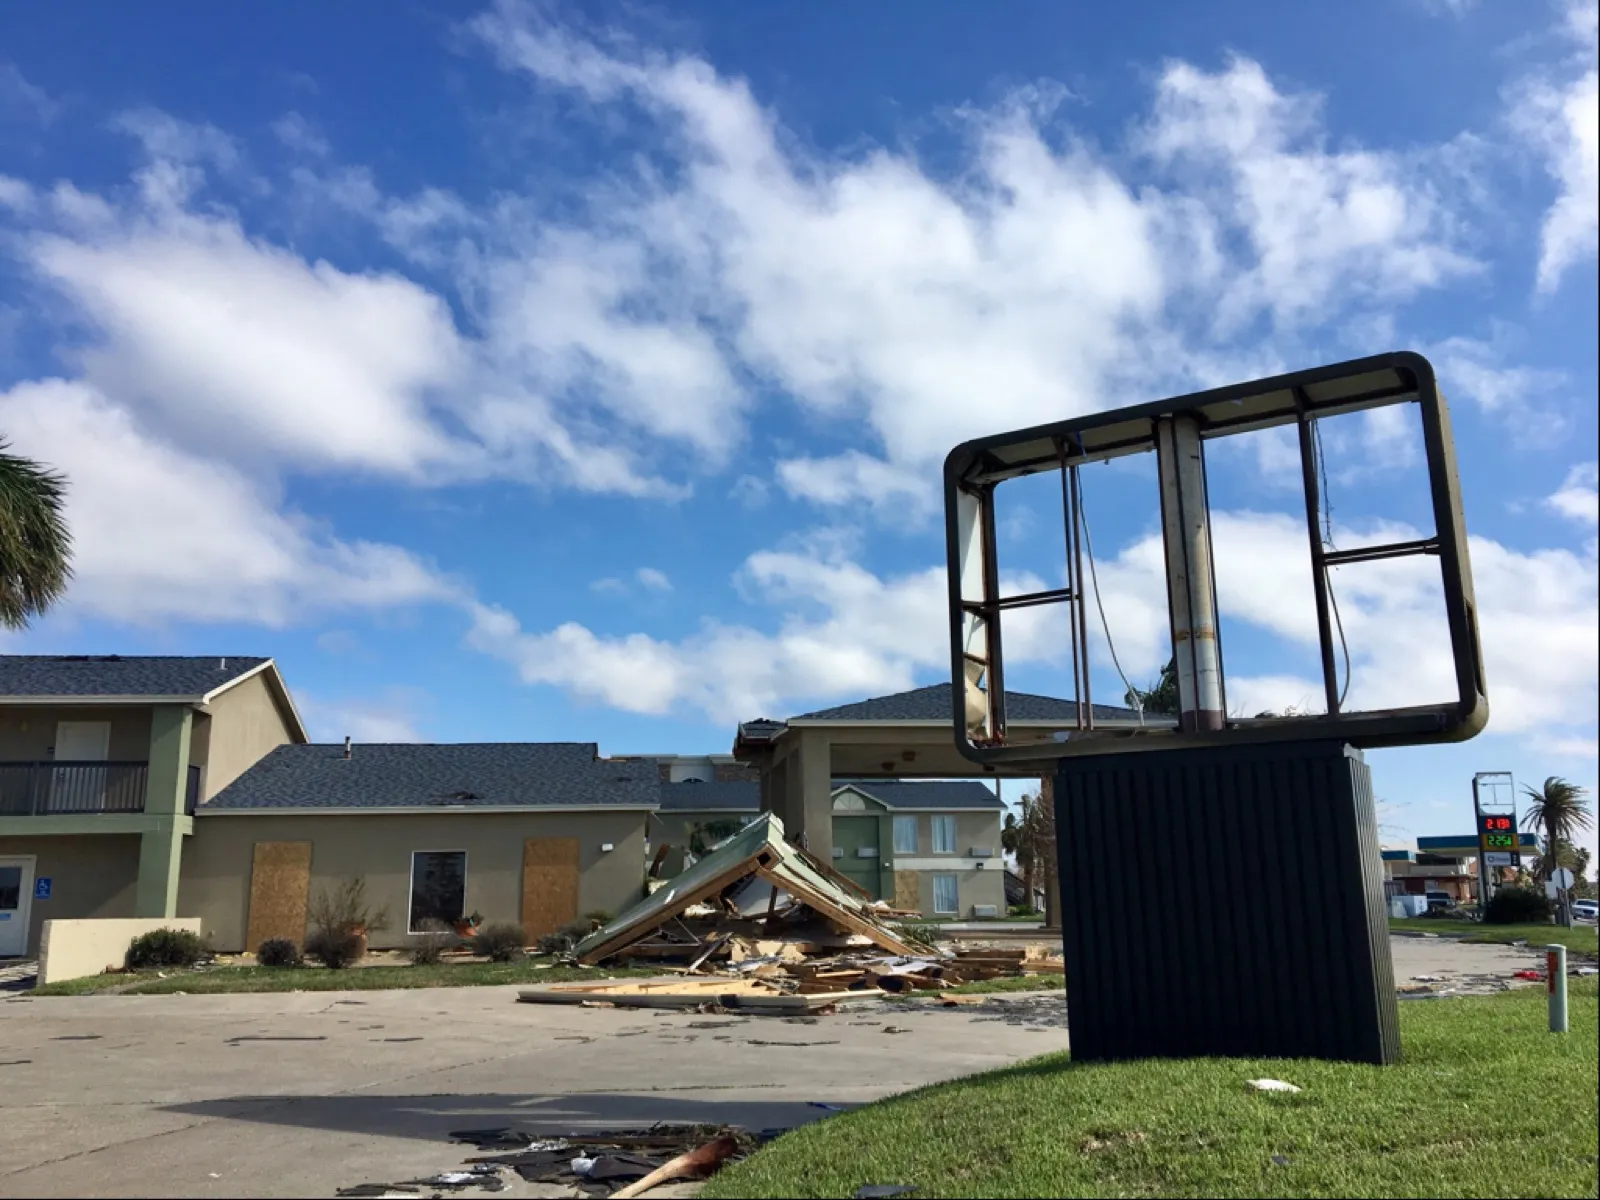
Harvey made landfall near Rockport, Texas, on August 25, 2017, around 10:00 p.m. CDT with Category 4 intensity.1 Maximum sustained winds of 130 mph (209 km/h) lashed the coast, with gusts exceeding 150 mph (240 km/h) in coastal areas. The storm surge reached 8–10 ft (2.4–3.0 m) in the landfall region, inundating coastal communities and barrier islands. Structural damage was severe in the immediate coastal zone: homes were demolished, boats were sunk, and vegetation was stripped bare by hurricane-force winds.
Harvey's worst impact came inland. As the hurricane weakened in wind terms, declining to tropical-storm status, its slow movement kept rainbands over southeastern Texas. For nearly four days it produced torrential rainfall, with training thunderstorm cells repeatedly moving over the same areas. Radar showed bands of intense convection crossing Houston again and again, dropping 4–8 in (10–20 cm) of rain per hour in some locations.
Catastrophic Flooding
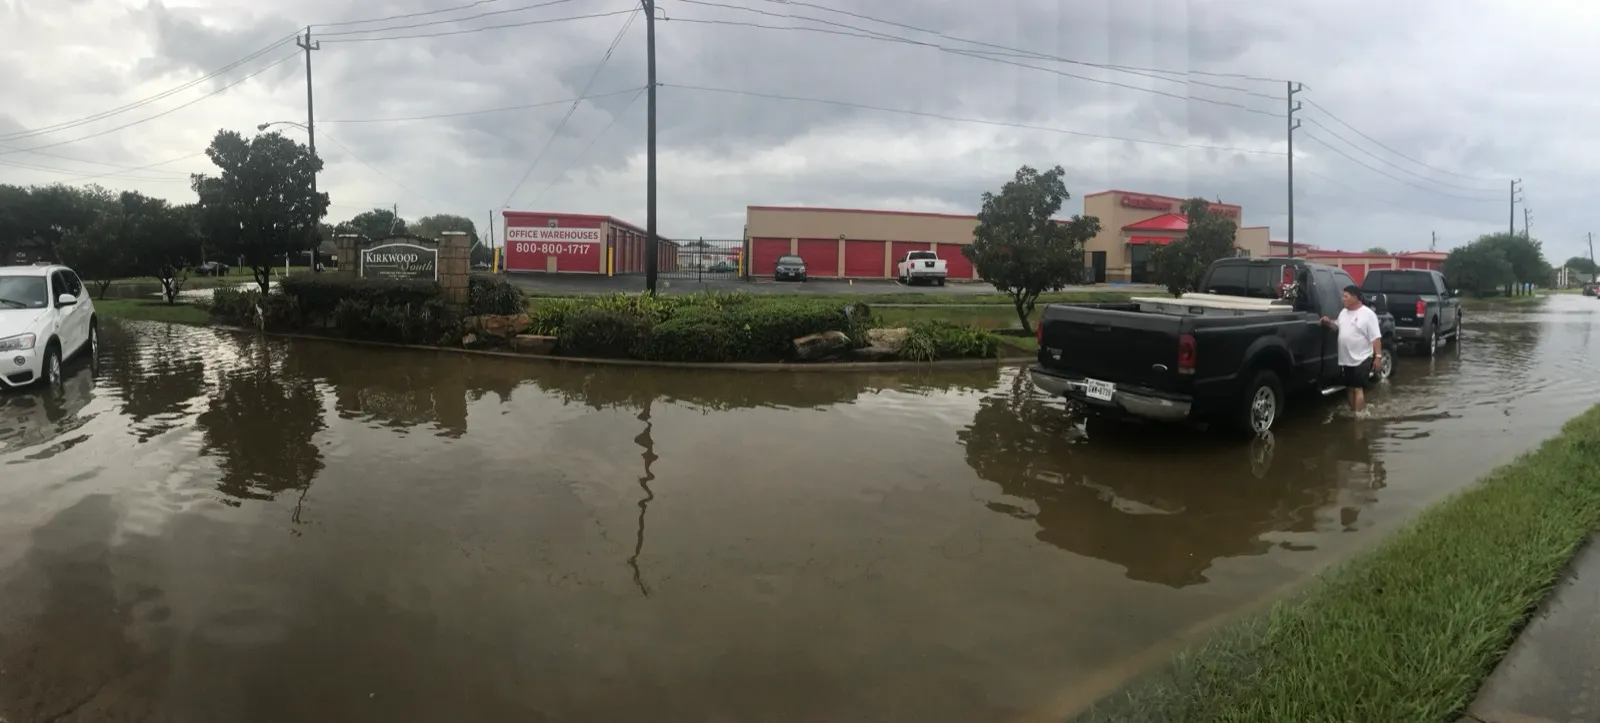
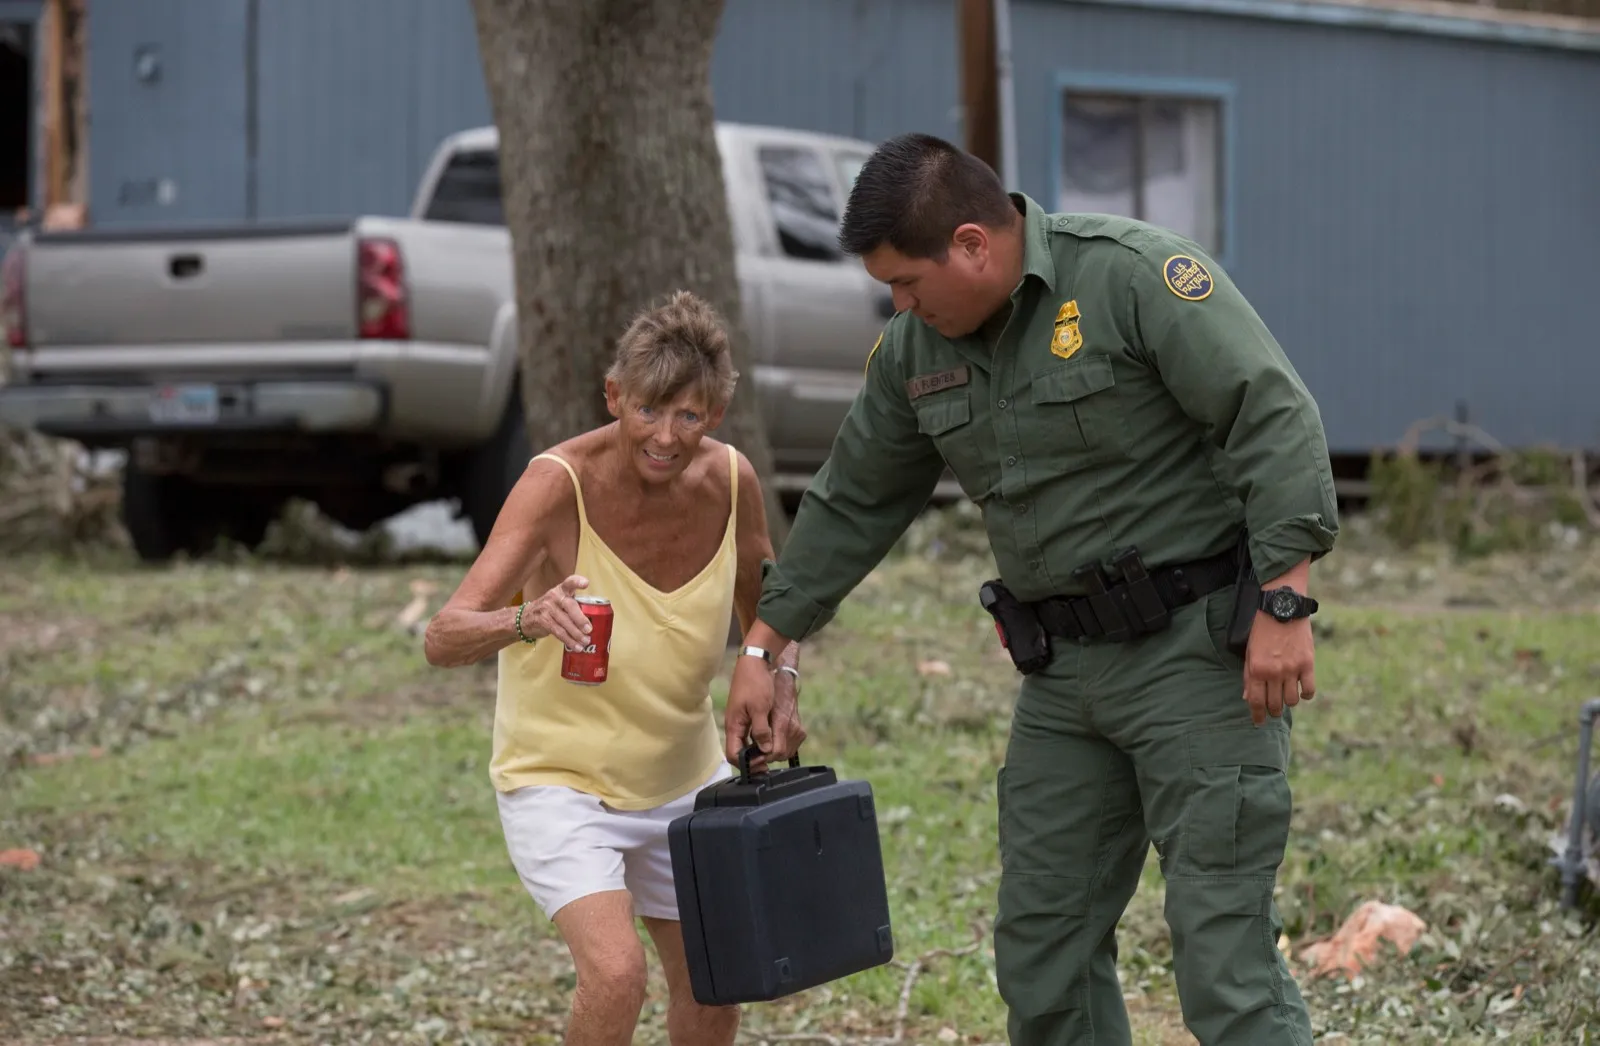
The rainfall totals were staggering: Nederland, Texas, received 60.58 in (1,539 mm), setting a new continental U.S. record for tropical cyclone rainfall.1 Other areas received 35–47 in (900–1,200 mm). This precipitation overwhelmed drainage infrastructure designed for typical tropical storms. Bayous overflowed; detention ponds filled to capacity; rivers rose to record levels. Flash flooding inundated neighborhoods, trapping residents in attics and on roofs. Lakes that had been at normal levels rose 7–10 ft (2–3 m) in days. Flooding devastated the greater Houston metropolitan area and spread across southeast Texas, from Rockport through Houston to Beaumont and Port Arthur.
Flood-control systems are designed for specified conditions and retain residual risk. Harvey’s exceptional rain exceeded the capacity of many systems; performance varied by location and facility.
Human Toll & Mortality
Hurricane Harvey caused 68 direct deaths, making it one of the deadliest recent U.S. hurricanes. However, the mechanisms of death differed from typical wind-driven storms. Most deaths resulted from flash flooding, drowning in swollen waters, or vehicle accidents in flooded areas. The elderly and disabled, trapped by rising water, accounted for a significant proportion of fatalities. Unlike wind-driven hurricanes that kill through structural failure and wind-related injuries, Harvey's deaths were largely water-related.
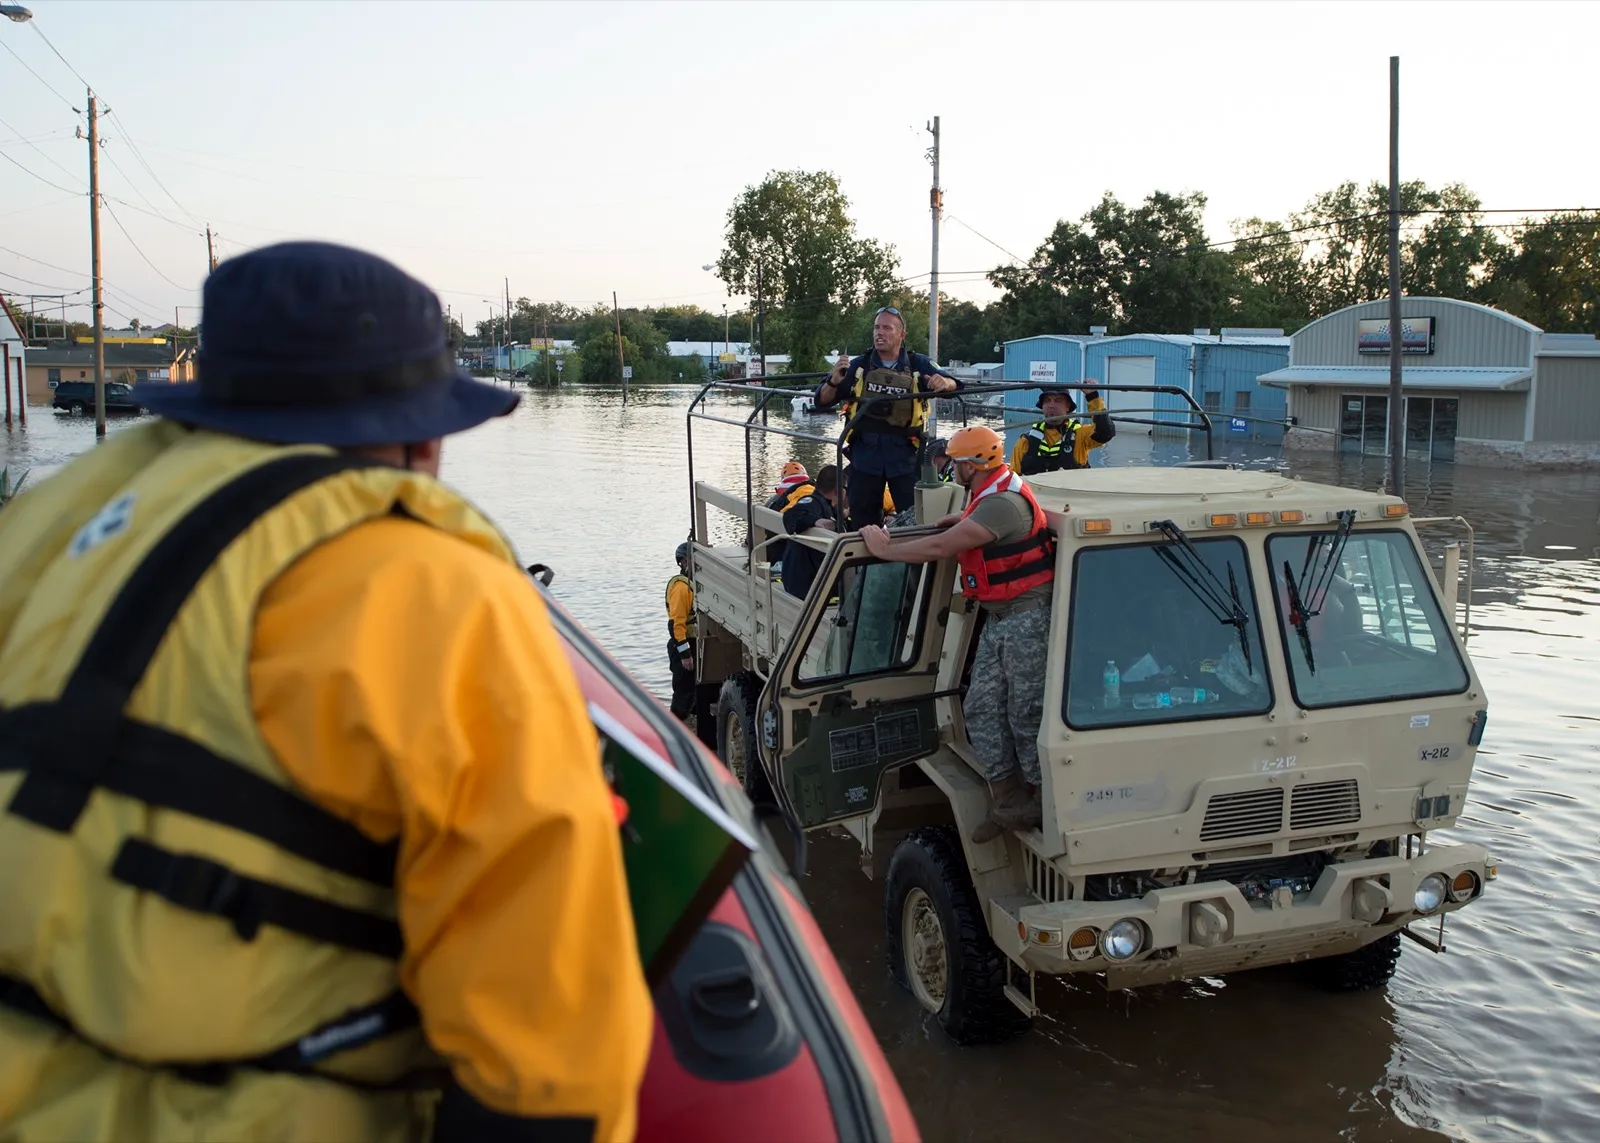
Harvey displaced many residents and damaged homes, businesses, roads, and other infrastructure across southeastern Texas. Recovery duration varied greatly among households and communities.
Economic Impact
Hurricane Harvey caused $125 billion in estimated U.S. damage (2017 dollars), making it the second-costliest hurricane in U.S. history behind Katrina.2 Insured-loss estimates use different definitions and price bases; subtracting an unmatched insured figure from the total would not establish uninsured losses. Recovery was slow and incomplete for many. Flood insurance proved inadequate for many policyholders, and disputes with insurers prolonged recovery. Small businesses, many of which lacked comprehensive coverage, faced years of financial hardship.
Energy, transport, and industrial operations were disrupted alongside household losses. Aggregate regional output and individual recovery are different measures; a claim about a multi-year regional contraction requires a defined economic dataset.
Climate Change & Future Risk
Hurricane Harvey occurred in an era of significant climate change. The warm sea surface temperatures that fueled Harvey's rapid intensification were above historical averages, and the atmospheric moisture content was elevated above what the same atmospheric circulation would have produced in pre-warming conditions. Scientific analyses suggest that Harvey's rainfall was approximately 15% more intense than it would have been in a non-warming climate.3 Attribution results like this carry real uncertainty, and we would not lean on the exact figure; what we take from them is the direction and the rough size of the effect, both of which point the same way.
Warmer air can support heavier rainfall. The cited event-attribution study concerns Harvey’s rainfall, not proof that similar stalls will become more frequent. Changes in storm motion remain a separate research question.
Sources
-
Blake, E. S., & Zelinsky, D. A. (2018). Tropical Cyclone Report: Hurricane Harvey (AL092017). National Hurricane Center, NOAA. https://www.nhc.noaa.gov/data/tcr/AL092017_Harvey.pdf ↩ ↩2 ↩3 ↩4 ↩5
-
NOAA National Centers for Environmental Information. (2024). U.S. Billion-Dollar Weather and Climate Disasters. https://www.ncei.noaa.gov/access/billions/ ↩ ↩2
-
van Oldenborgh, G. J., et al. (2017). Attribution of extreme rainfall from Hurricane Harvey, August 2017. Environmental Research Letters, 12(12), 124009. https://doi.org/10.1088/1748-9326/aa9ef2 ↩