The Intelligence System is our storm-modeling workbench: a set of browser-based tools, in active development, that let you explore hurricane dynamics hands-on rather than only read about them. Each tool is built on the same public data and physics as the rest of the site, from NOAA's best-track records to the principles behind operational surge models, with the heavy numerical work running on a dedicated compute backend. Four are live now, the Storm Explorer, the Historical Tracker, the Active Tracker, and Digital Elevation, with the rest coming online.
Storm Explorer
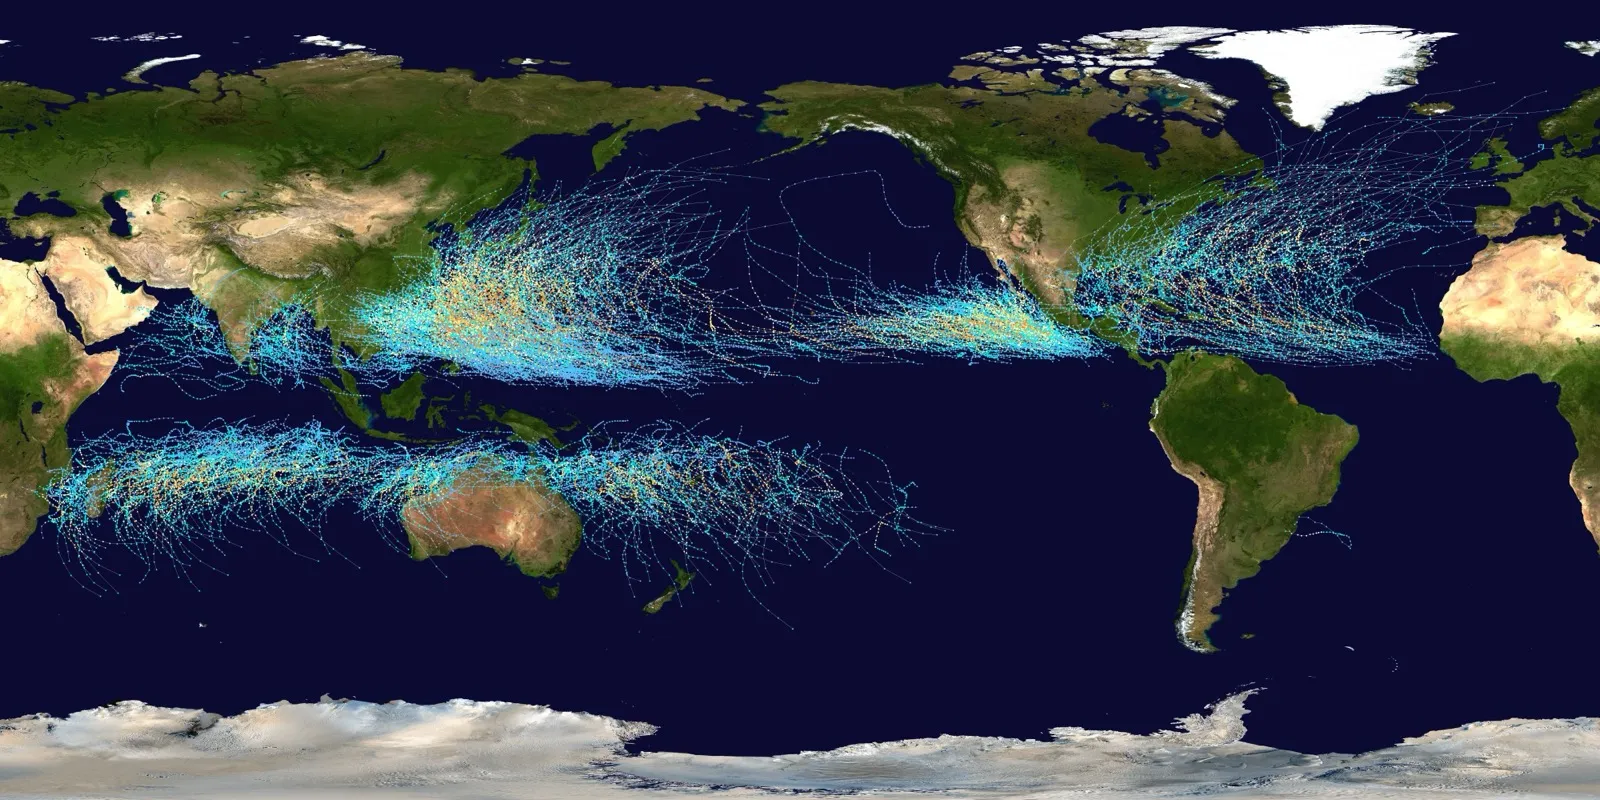
The Storm Explorer maps every Atlantic tropical cyclone from 1851 to 2025, more than 2,000 storms, and lets you filter them by category, maximum sustained wind, central-pressure deficit, forward translation speed, name, or distance from any point, in any combination. Pick any storm from the results and open it directly in the Historical Tracker.
Historical Tracker
Using NOAA's HURDAT2 best-track database, the official record of Atlantic tropical cyclones back to 1851, the Historical Tracker lets you replay any past hurricane's track and intensity over time.1 Each track is color-coded by Saffir-Simpson category (tropical depression through Category 5), and you can scrub through the storm step by step while the radius of maximum winds is drawn at each step. It turns the storm spotlights elsewhere on this site into something you can watch unfold.
▶ Open the Historical Tracker →
Active Tracker
The Active Tracker follows active storms using the National Hurricane Center's official advisory: the current position, NHC's forecast track colored by Saffir-Simpson category, and the forecast cone of uncertainty, drawn on the SimStorm satellite map and refreshed as new advisories are issued. Storms are grouped by basin, and when more than one is active you choose which to follow. It reproduces no forecast of its own; it visualizes NHC's official product, and links straight to the advisory, discussion, and cone graphic. When nothing is active, it says so.
Digital Elevation
Storm surge is a question about ground height, so the Digital Elevation tool puts the ground itself on the map. It renders bare-earth elevation from the USGS 3D Elevation Program: the 1-metre lidar digital elevation model where lidar has been flown, and the seamless 1/3 arc-second (about 10 m) model elsewhere, which is the layer that covers Puerto Rico and the US Virgin Islands.23 You can shade the low-lying coast, read the ground elevation at any point, tilt the map into 3D, and see immediately why a few feet of elevation decides which streets flood and which stay dry.
Heights come out of the source in its own vertical datum rather than one common one. Over the continental United States 3DEP elevations are referenced to the North American Vertical Datum of 1988 (NAVD88); the island territories use their own datums, and NOAA's VDatum handles NAVD88, PRVD02 for Puerto Rico, VIVD09 for the US Virgin Islands, and local mean sea level as separate vertical frames.34 We show each reading in its native datum and label it, so a height is never ambiguous. Tide and surge work needs a single datum instead, so any reading can be converted to mean sea level through VDatum, which returns the uncertainty of the conversion alongside the result.4
It is a map of ground height, not a flood forecast. For surge guidance, use the National Hurricane Center.
Wind Field Generator
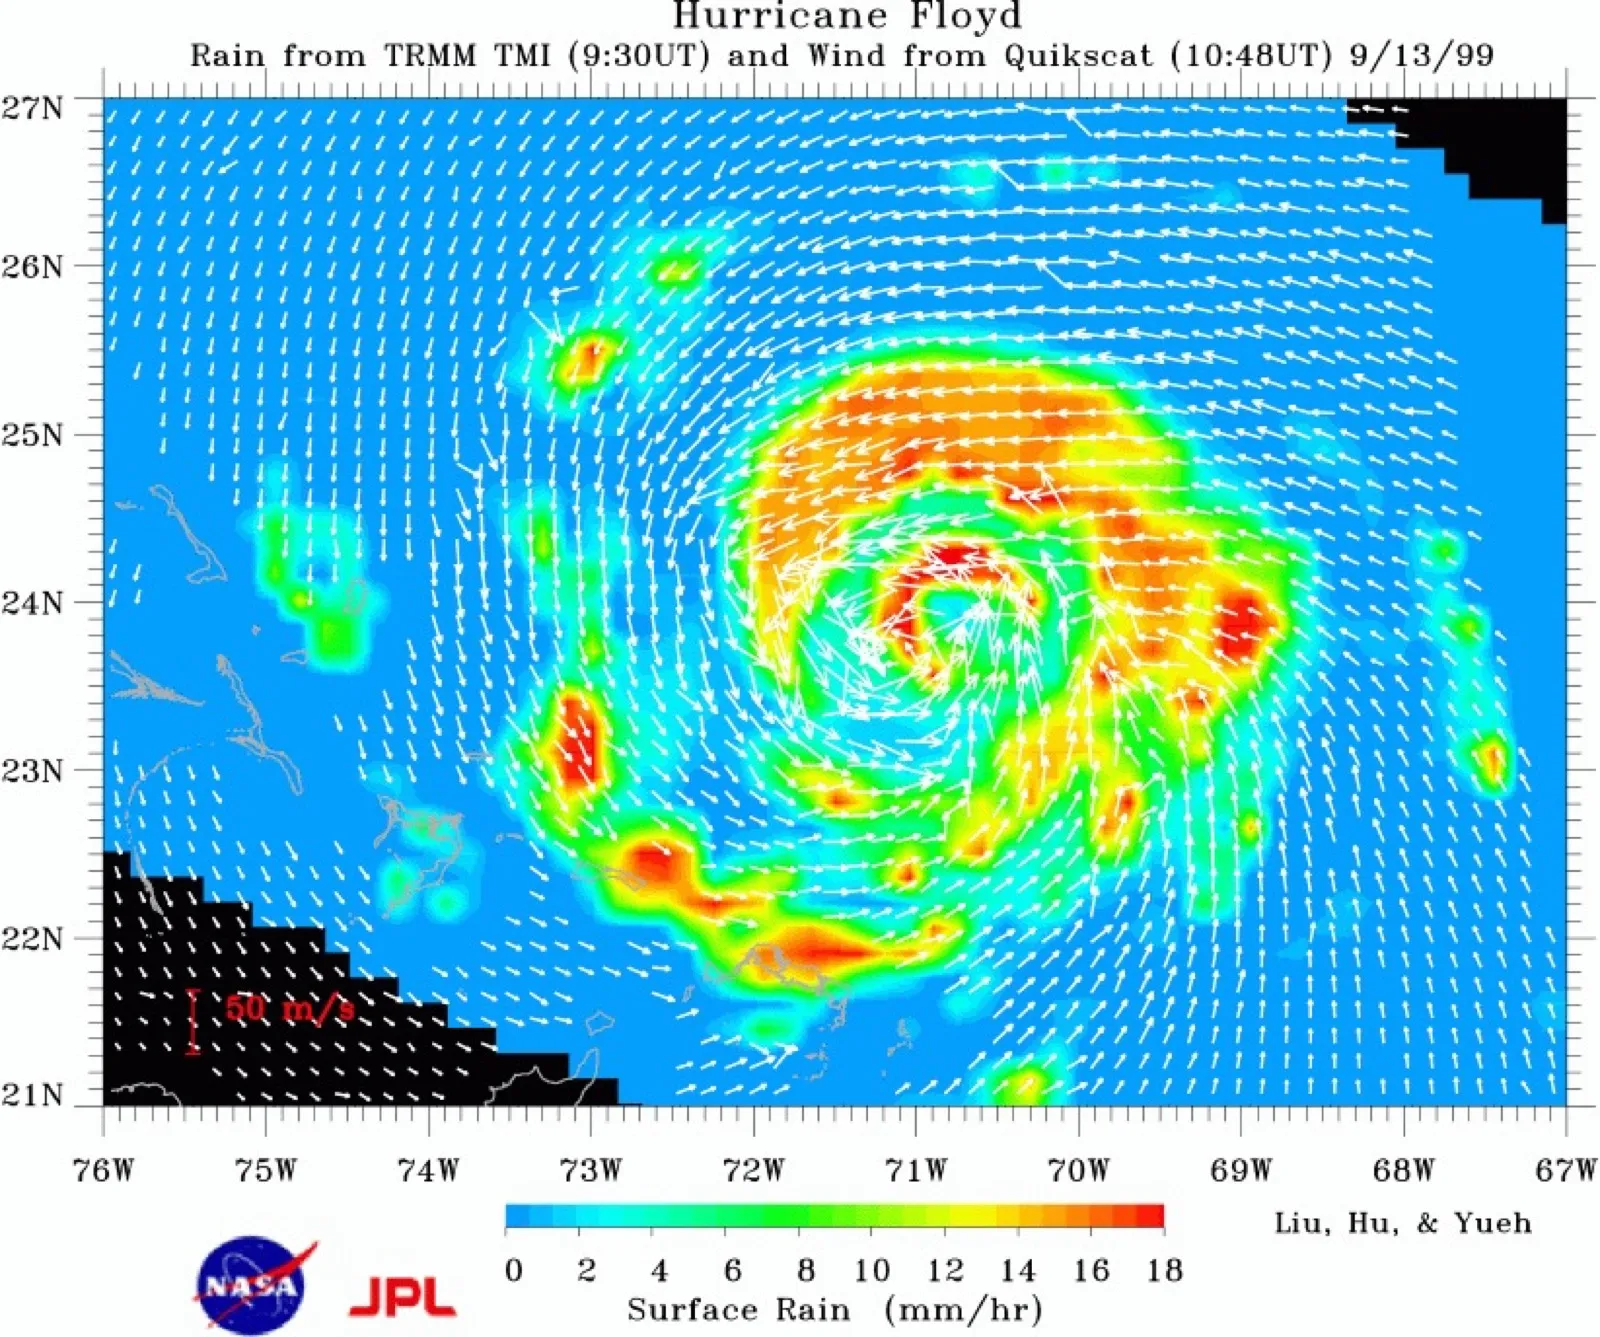
A hurricane's winds are not uniform, and that wind field is what drives surge and damage downstream. The wind field generator will visualize a storm's asymmetric structure (the radius of maximum winds, the stronger right-front quadrant, and how winds fall off with distance from the center), making it clear why two storms of the same category can do very different damage depending on size and motion.
Storm Surge Simulator
Storm surge is the deadliest hurricane hazard, and it's exquisitely sensitive to a storm's details. Driven by the wind field above, the surge simulator will let you vary a hurricane's category, track angle, forward speed, and the shape of the coastline to see how the resulting surge height and inland flooding change, grounded in the same shallow-water physics that drives NOAA's operational SLOSH (Sea, Lake, and Overland Surges from Hurricanes) model.5
Surge modeling is the work we've spent years on, so a word on what this tool is and isn't. It runs a simplified, fast version of the physics, enough to build real intuition for how category, forward speed, and shelf shape trade off against each other, but it uses idealized coastlines, not the surveyed bathymetry an operational SLOSH run ingests. A simulator that hides its assumptions is worse than useless, so ours will always show you the knobs it exposes and the ones it fixes. Use it to understand surge; never use it to decide whether to evacuate.

Flood Risk Calculator
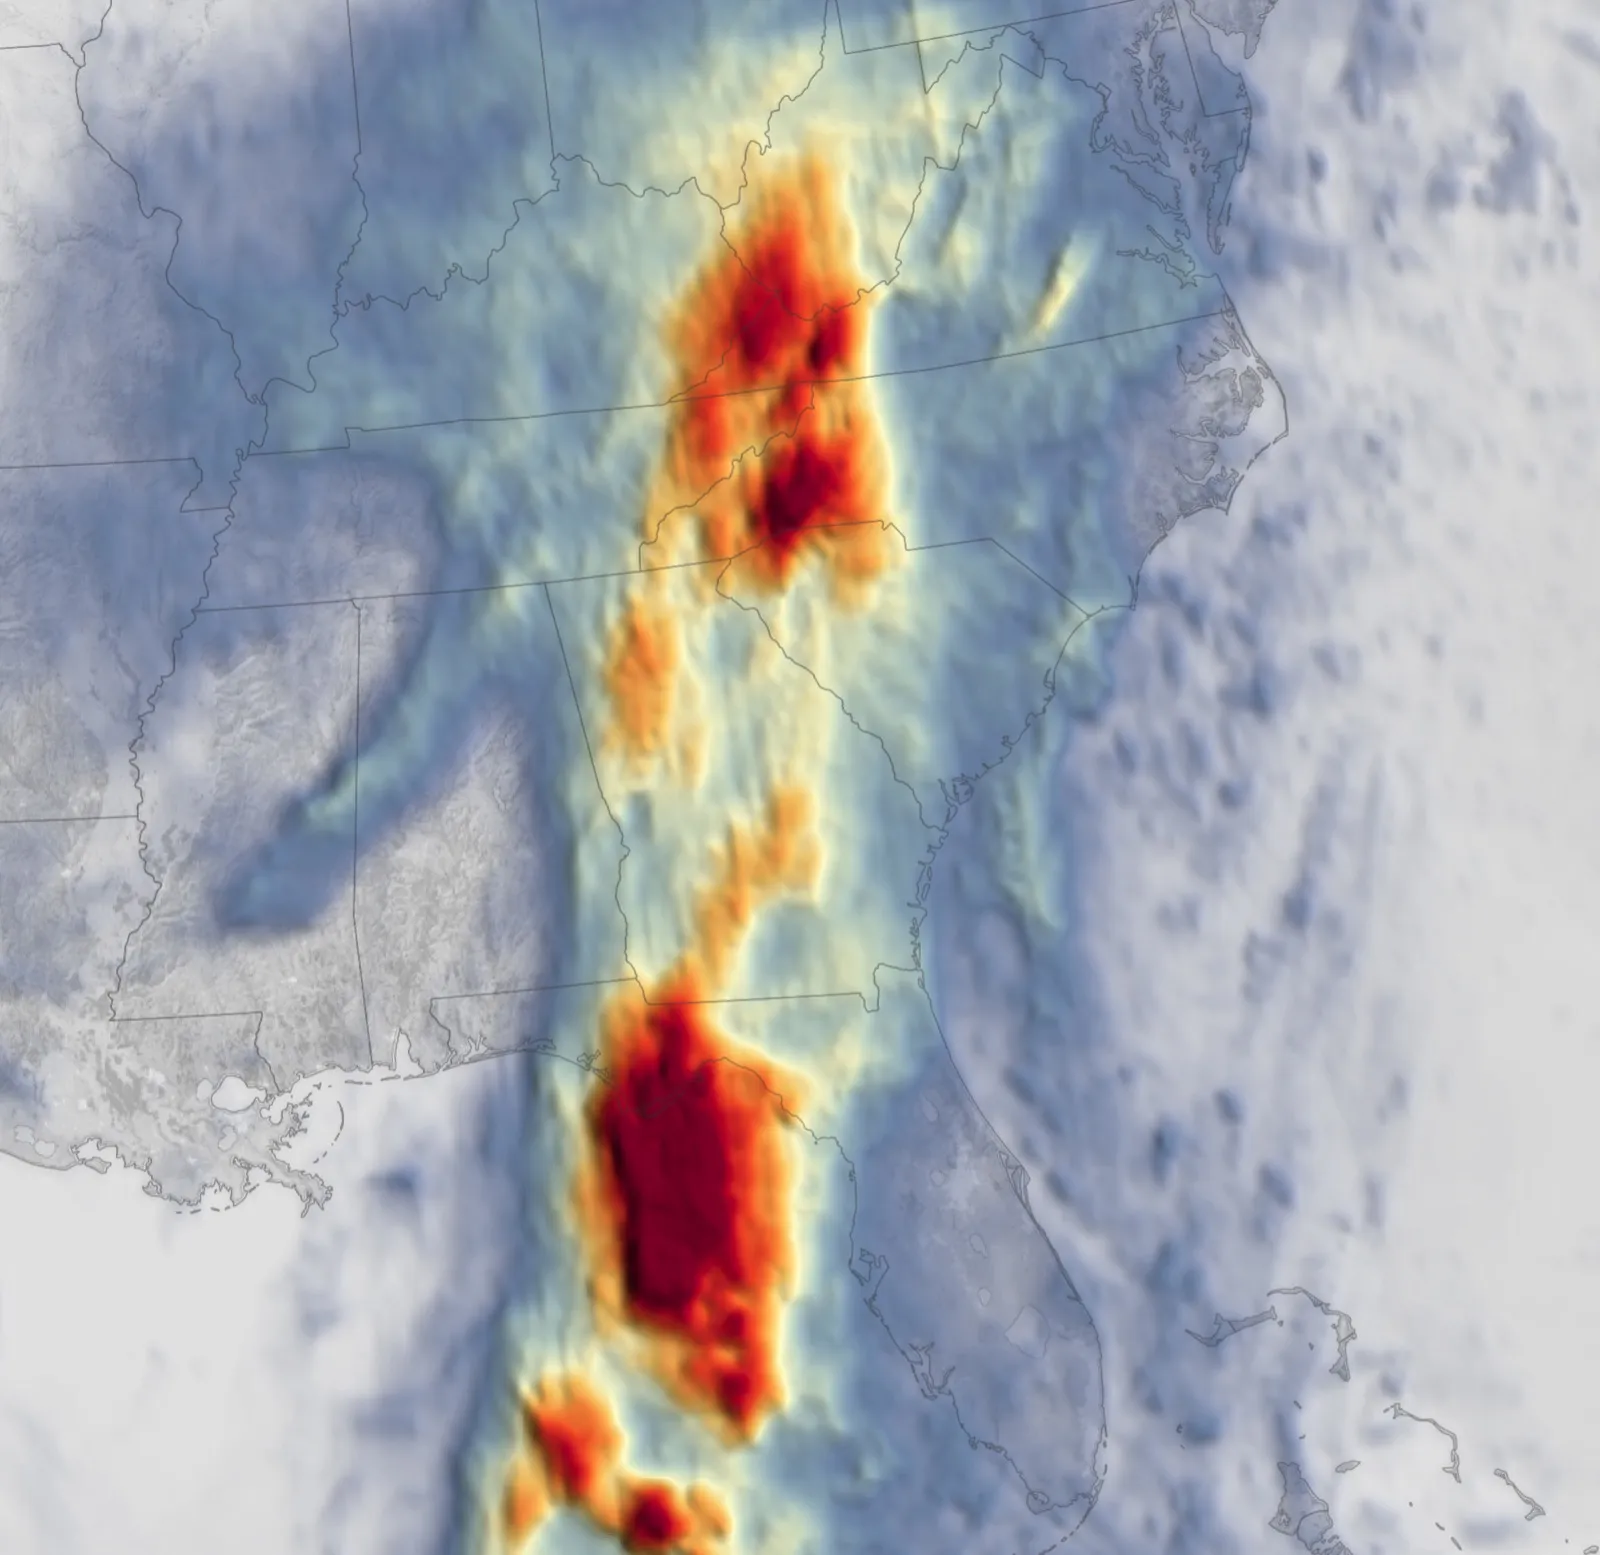
Combining storm surge, rainfall, and a location's elevation, the flood risk calculator will translate those factors into a plain-language risk picture for a chosen spot. It's designed around the hard lesson of storms like Harvey, Florence, and Ida: inland, rainfall-driven flooding is now a leading cause of hurricane deaths, often far from the coast.
Scenario Comparison
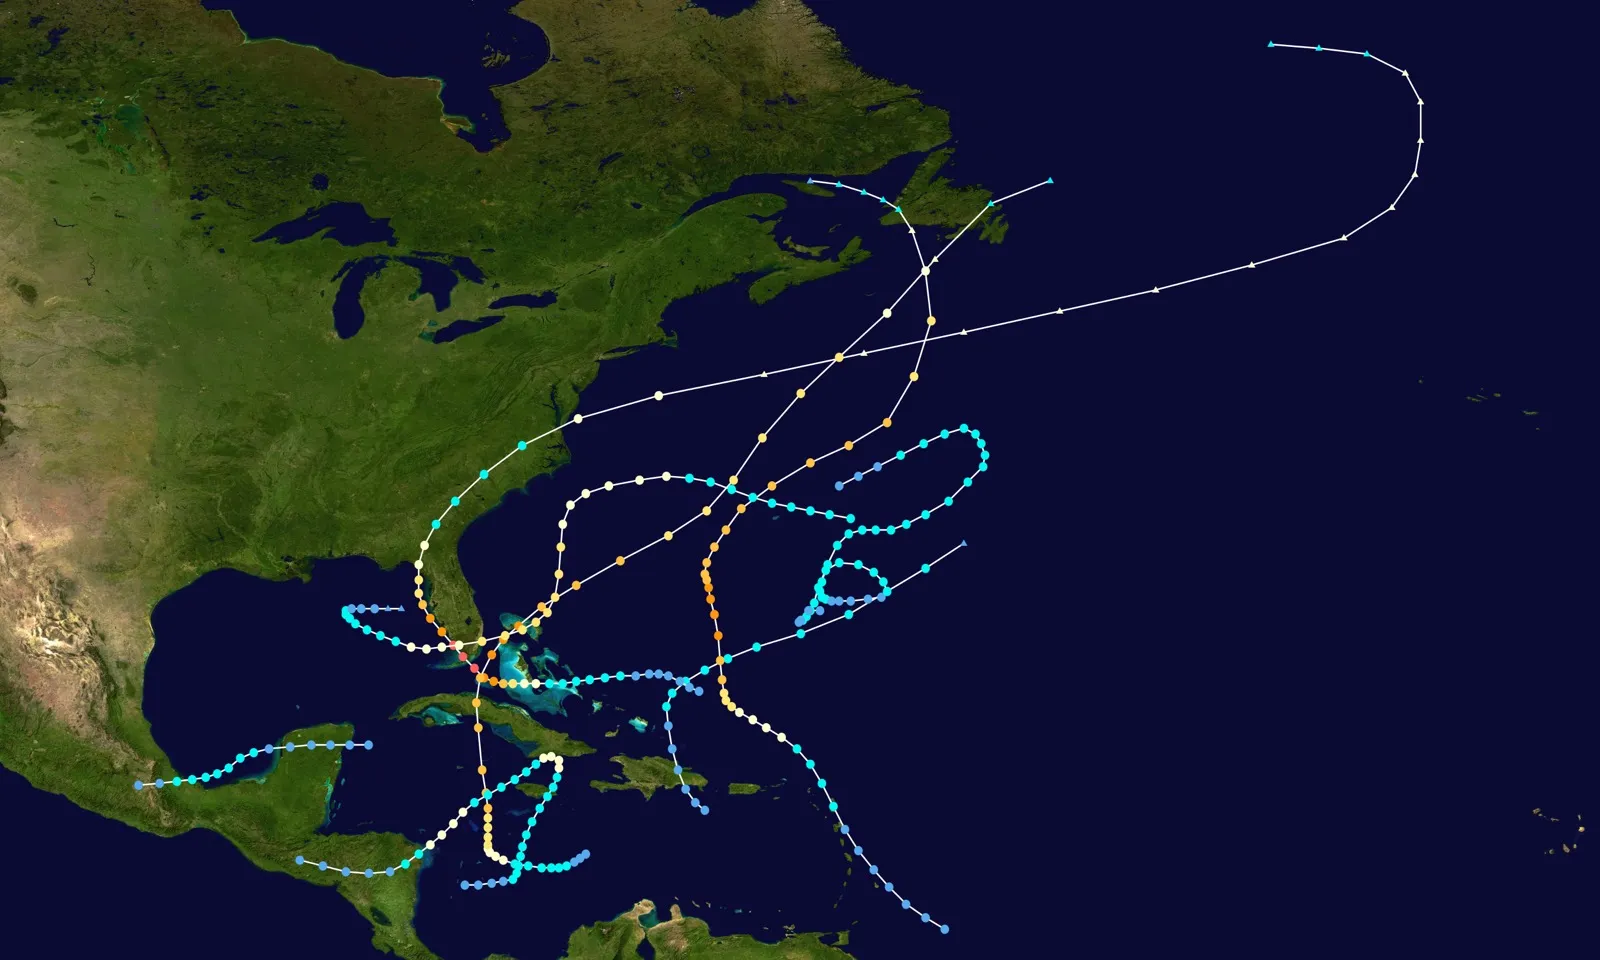
Finally, scenario comparison will place "what-if" storms side by side: shift a track fifty miles (80 km), nudge a storm up a category, or slow its forward speed, and see how the impacts diverge. The goal is intuition, an instinct for how small changes in a storm translate into large changes on the ground.
Under the Hood
SimStorm's interface runs in your browser; the demanding numerical work that computes surge and wind fields runs on a separate compute backend. Everything is built on authoritative data, HURDAT2 for the tracks, SLOSH physics for the surge, and the same transparent science as the forecasting and hazards articles across this site. Where a tool simplifies, we say so on the tool.
One line matters more than any other on this page, so read it plainly: SimStorm is a teaching and exploration tool, not a forecast. Its simulations use idealized inputs and simplified physics to build intuition, and they are not operational predictions of any real storm. When a hurricane is actually threatening, the only authoritative source is the National Hurricane Center at hurricanes.gov; follow it and your local officials, not this site's models.
SimStorm is under active development; this page previews the tools as they come online.
Sources
-
National Hurricane Center. HURDAT2 — Atlantic Hurricane Database. NOAA. https://www.nhc.noaa.gov/data/ ↩
-
U.S. Geological Survey. 1 meter Digital Elevation Models (DEMs) — USGS National Map 3DEP Downloadable Data Collection. ScienceBase. "USGS standard one-meter DEMs are produced exclusively from high resolution light detection and ranging (lidar) source data of one-meter or higher resolution." https://www.sciencebase.gov/catalog/item/543e6b86e4b0fd76af69cf4c ↩
-
U.S. Geological Survey. 1/3rd arc-second Digital Elevation Models (DEMs) — USGS National Map 3DEP Downloadable Data Collection. ScienceBase. "The seamless 1/3 arc-second DEM layer provides coverage of the conterminous United States, Hawaii, Puerto Rico, other territorial islands, and in limited areas of Alaska," and elevations "over the continental United States, are referenced to the North American Vertical Datum of 1988 (NAVD88)." https://www.sciencebase.gov/catalog/item/4f70aa9fe4b058caae3f8de5 ↩ ↩2
-
National Oceanic and Atmospheric Administration, National Ocean Service. VDatum Web Services / API Documentation. Supported vertical frames include NAVD88, PRVD02, VIVD09 and LMSL; each transformation returns an
uncertaintyvalue. https://vdatum.noaa.gov/docs/services.html ↩ ↩2 -
National Weather Service / National Hurricane Center. SLOSH (Sea, Lake, and Overland Surges from Hurricanes) Model. NOAA. https://www.nhc.noaa.gov/surge/slosh.php ↩