Inland rainfall flooding is a major hurricane hazard, including far from the coast. The cited 1963–2012 study attributed about 49% of U.S. direct tropical-cyclone deaths to surge and 27% to rainfall flooding.1
Why Hurricanes Produce So Much Rain
The Thermodynamic Engine
Tropical cyclones run on heat transferred from warm ocean water to the atmosphere. A hurricane moving over 80°F (26.7°C) water evaporates moisture continuously, and that moisture-laden air rises through the storm's convective towers, condenses in the eyewall and rainbands, releases its latent heat, and drives rainfall rates that can exceed 2 inches per hour (51 mm/hour).
Eyewall and Rainband Structure
Heavy rainfall can occur in the eyewall and in rainbands well away from the center. Outer bands can contain intense thunderstorms; there is no universal rate separating them from the inner core.
Forward Speed as a Multiplier
Slow movement can keep rainbands over one area longer, but there is no fixed multiplier between storm speed and rainfall in real events. Harvey’s prolonged rainfall after landfall illustrates how movement and persistent moisture supply can combine.
Rainfall Distribution in a Hurricane
The Asymmetric Pattern
Rainfall is asymmetric. Vertical shear can organize the rain relative to the shear direction, which is not necessarily the same as the track direction. Terrain, fronts, and band evolution also affect where the heaviest rain falls.2
From Eyewall to Outer Bands
Average rainfall patterns vary with radius, but observed local accumulations need not decrease steadily away from the center. The cited satellite study does not establish fixed storm-total ranges for eyewitness locations in the eyewall, inner bands, and outer bands.2
Inland Flooding: The Hidden Killer
Freshwater flooding can rise rapidly in small streams or develop over days in larger rivers. A weakening or departing cyclone can therefore remain dangerous inland.
Range and Reach
Tropical cyclone rainfall reaches far inland, sometimes 500+ miles (800+ km). Hurricane Ike (2008) produced measurable rain as far as the Great Plains.3 Communities with no coastal exposure at all face real flood risk, and mountains make it worse: orographic enhancement, moist air forced up and over high terrain, can push much higher totals on windward slopes.
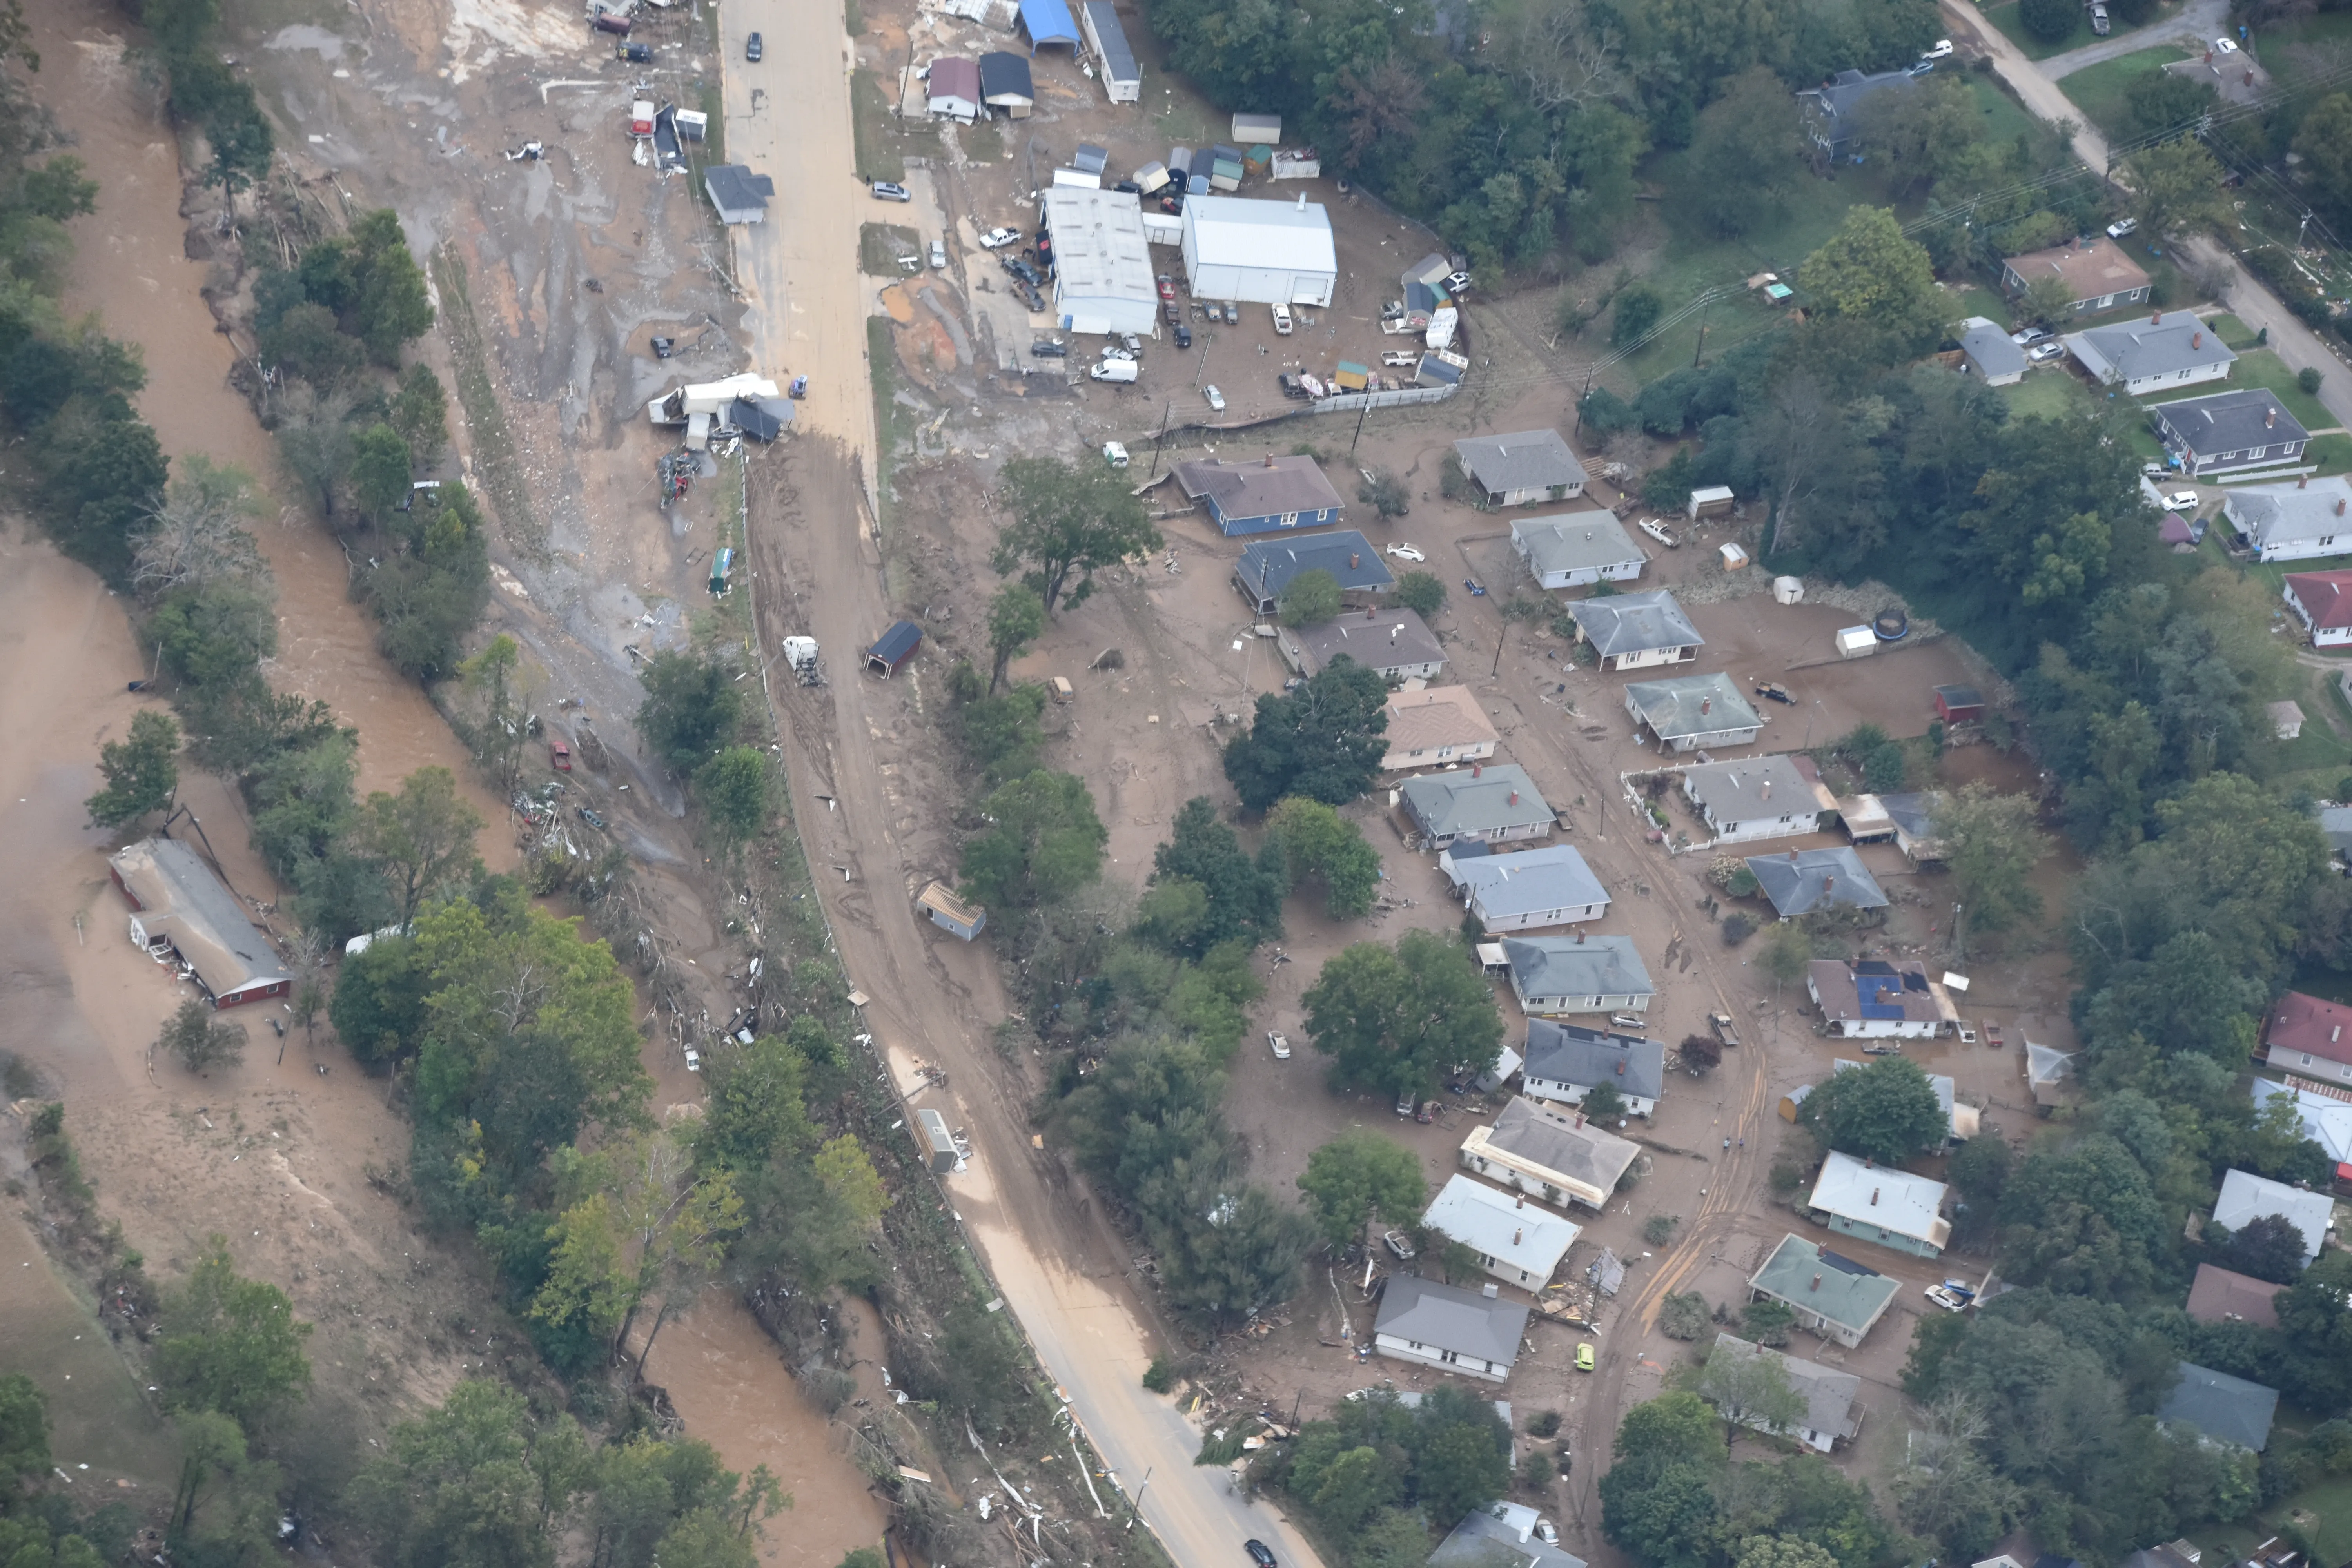
Hurricane Helene (2024) drove that lesson home in the southern Appalachians, hundreds of miles from where it came ashore.
River and Stream Flash Flooding
Heavy rain can rapidly raise streams and trigger landslides. Mitch’s 1998 rains caused catastrophic flooding and thousands of deaths in Central America, but extreme unofficial rainfall estimates should not be treated as verified gauge records.
Factors That Determine Flood Risk
Forward Speed
Slow movement is one warning sign, alongside moisture, terrain, antecedent rain, and the forecast distribution of heavy bands. A rapidly moving system can also cause flash flooding; consult rainfall and flood forecasts rather than applying a speed threshold.
Terrain and Orographic Enhancement
Mountains force moist air upward, where it cools and condenses. The Appalachians, Sierra Nevada, and Cascades can see higher totals than adjacent lowlands, and valleys and river basins concentrate the runoff, deepening the flood.
Soil Saturation and Antecedent Rainfall
Wet soils often produce more rapid runoff, but the amount depends on soil properties, drainage and rainfall intensity. Dry, compacted or burned ground can also generate substantial runoff; there is no universal doubling of flood depth.
Urbanization and Reduced Infiltration
Impervious surfaces generally reduce infiltration and speed runoff. The effect depends on land cover, soils, storage, and drainage design; fixed rural-versus-urban infiltration percentages are not universal.
Dam and Levee Failures
Structures built to hold water back can fail under extreme inflow, and when a dam or major levee goes, everything downstream faces a wall-of-water. Hurricane Katrina (2005) saw multiple levee failures in New Orleans, each releasing trapped floodwater over populated ground.
Tropical Cyclone Rainfall Records
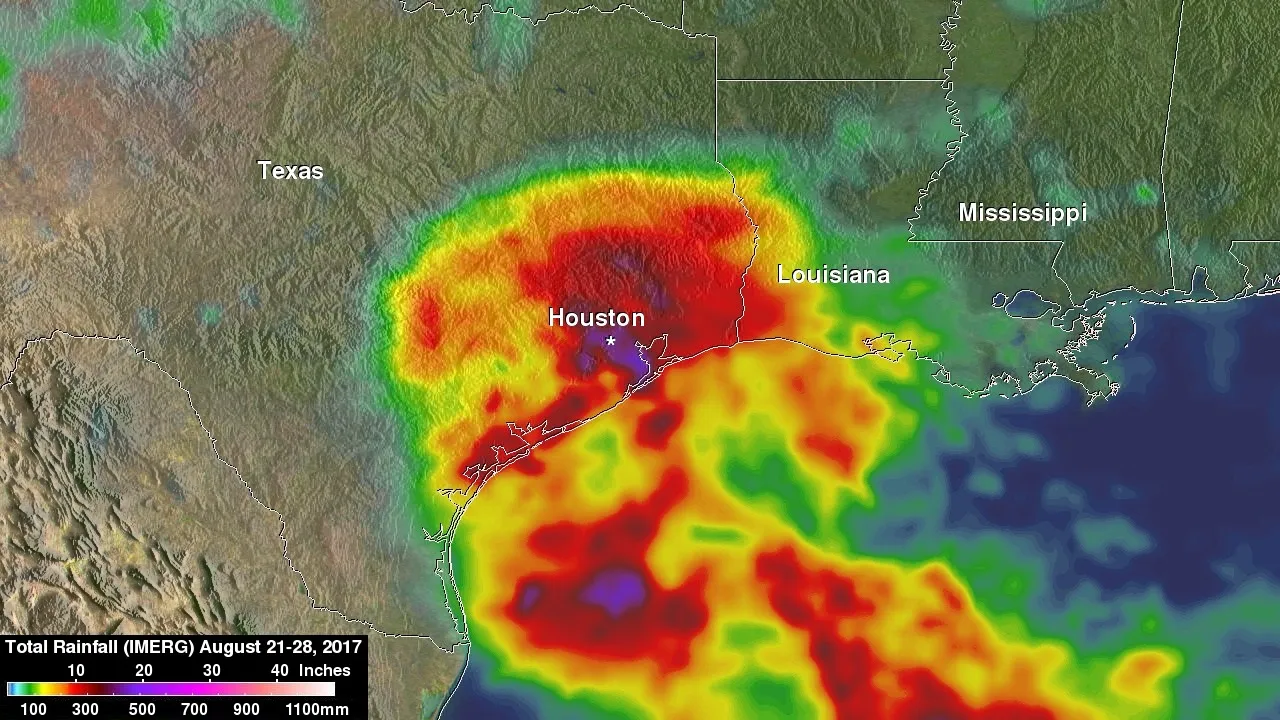
Hurricane Harvey (August 2017)
Harvey stalled over Southeast Texas after landfall and dumped 60.58 inches (1,539 mm) of rain near Nederland, a record for any tropical cyclone in the continental U.S.4 Other areas took 40–50+ inches (1,020–1,270+ mm). Total damage reached $125 billion in 2017 U.S. dollars, the majority from inland freshwater flooding, and more than 60 people died, many in flood-related causes.
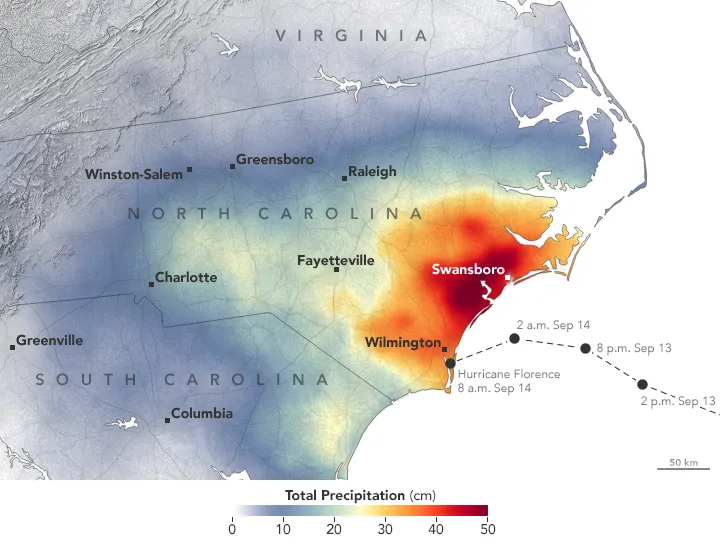
Hurricane Florence (September 2018)
Florence crawled across the Carolinas and produced 30–35+ inches (760–890+ mm) in parts of North Carolina.4 Flash flooding cut off communities and destroyed roads, and several dams were stressed, overtopped, but held. The slow forward speed was the key: Florence was barely moving at landfall, which maximized the inland totals.
Hurricane Mitch (Central America, October 1998)
Mitch caused catastrophic flooding and landslides in Central America in 1998. The NHC report distinguishes available measurements from much larger unofficial rainfall estimates; those estimates should not be presented as confirmed observations.
Tropical Storm Allison (Houston, June 2001)
Allison produced 38.6 inches of rain at the Port of Houston in June 2001, causing catastrophic flooding despite never becoming a hurricane.5
The Forward Speed Problem
Why Slow Storms Are Worst
A slow or stationary rain-producing circulation can prolong exposure and increase accumulations. Local rainfall forecasts are more useful than fixed multipliers based only on forward speed.
The Signal to Watch
If a cyclone is forecast to slow nearby, monitor official rainfall, flash-flood, and river forecasts. Slow movement is not itself an official flood warning. Prepare for disrupted access and follow local instructions.
Protecting Yourself from Inland Flooding
Know Your Flood Zone
Use FEMA's flood-zone maps (floodsmart.gov) to find your risk. Zones are based on the 100-year flood (a 1% annual probability). Homes in A, AE, or VE zones face serious risk; X zones outside the designated floodplain are lower-risk but not flood-proof. Know your elevation relative to nearby rivers and streams.
Heed Flash Flood Warnings
The National Weather Service issues flash flood watches (flooding possible) and warnings (flooding occurring or imminent). A warning means move to higher ground immediately, don't wait for an evacuation order. Flash flooding can arrive with little warning, and a few feet of moving water is enough to sweep away a vehicle or a person.
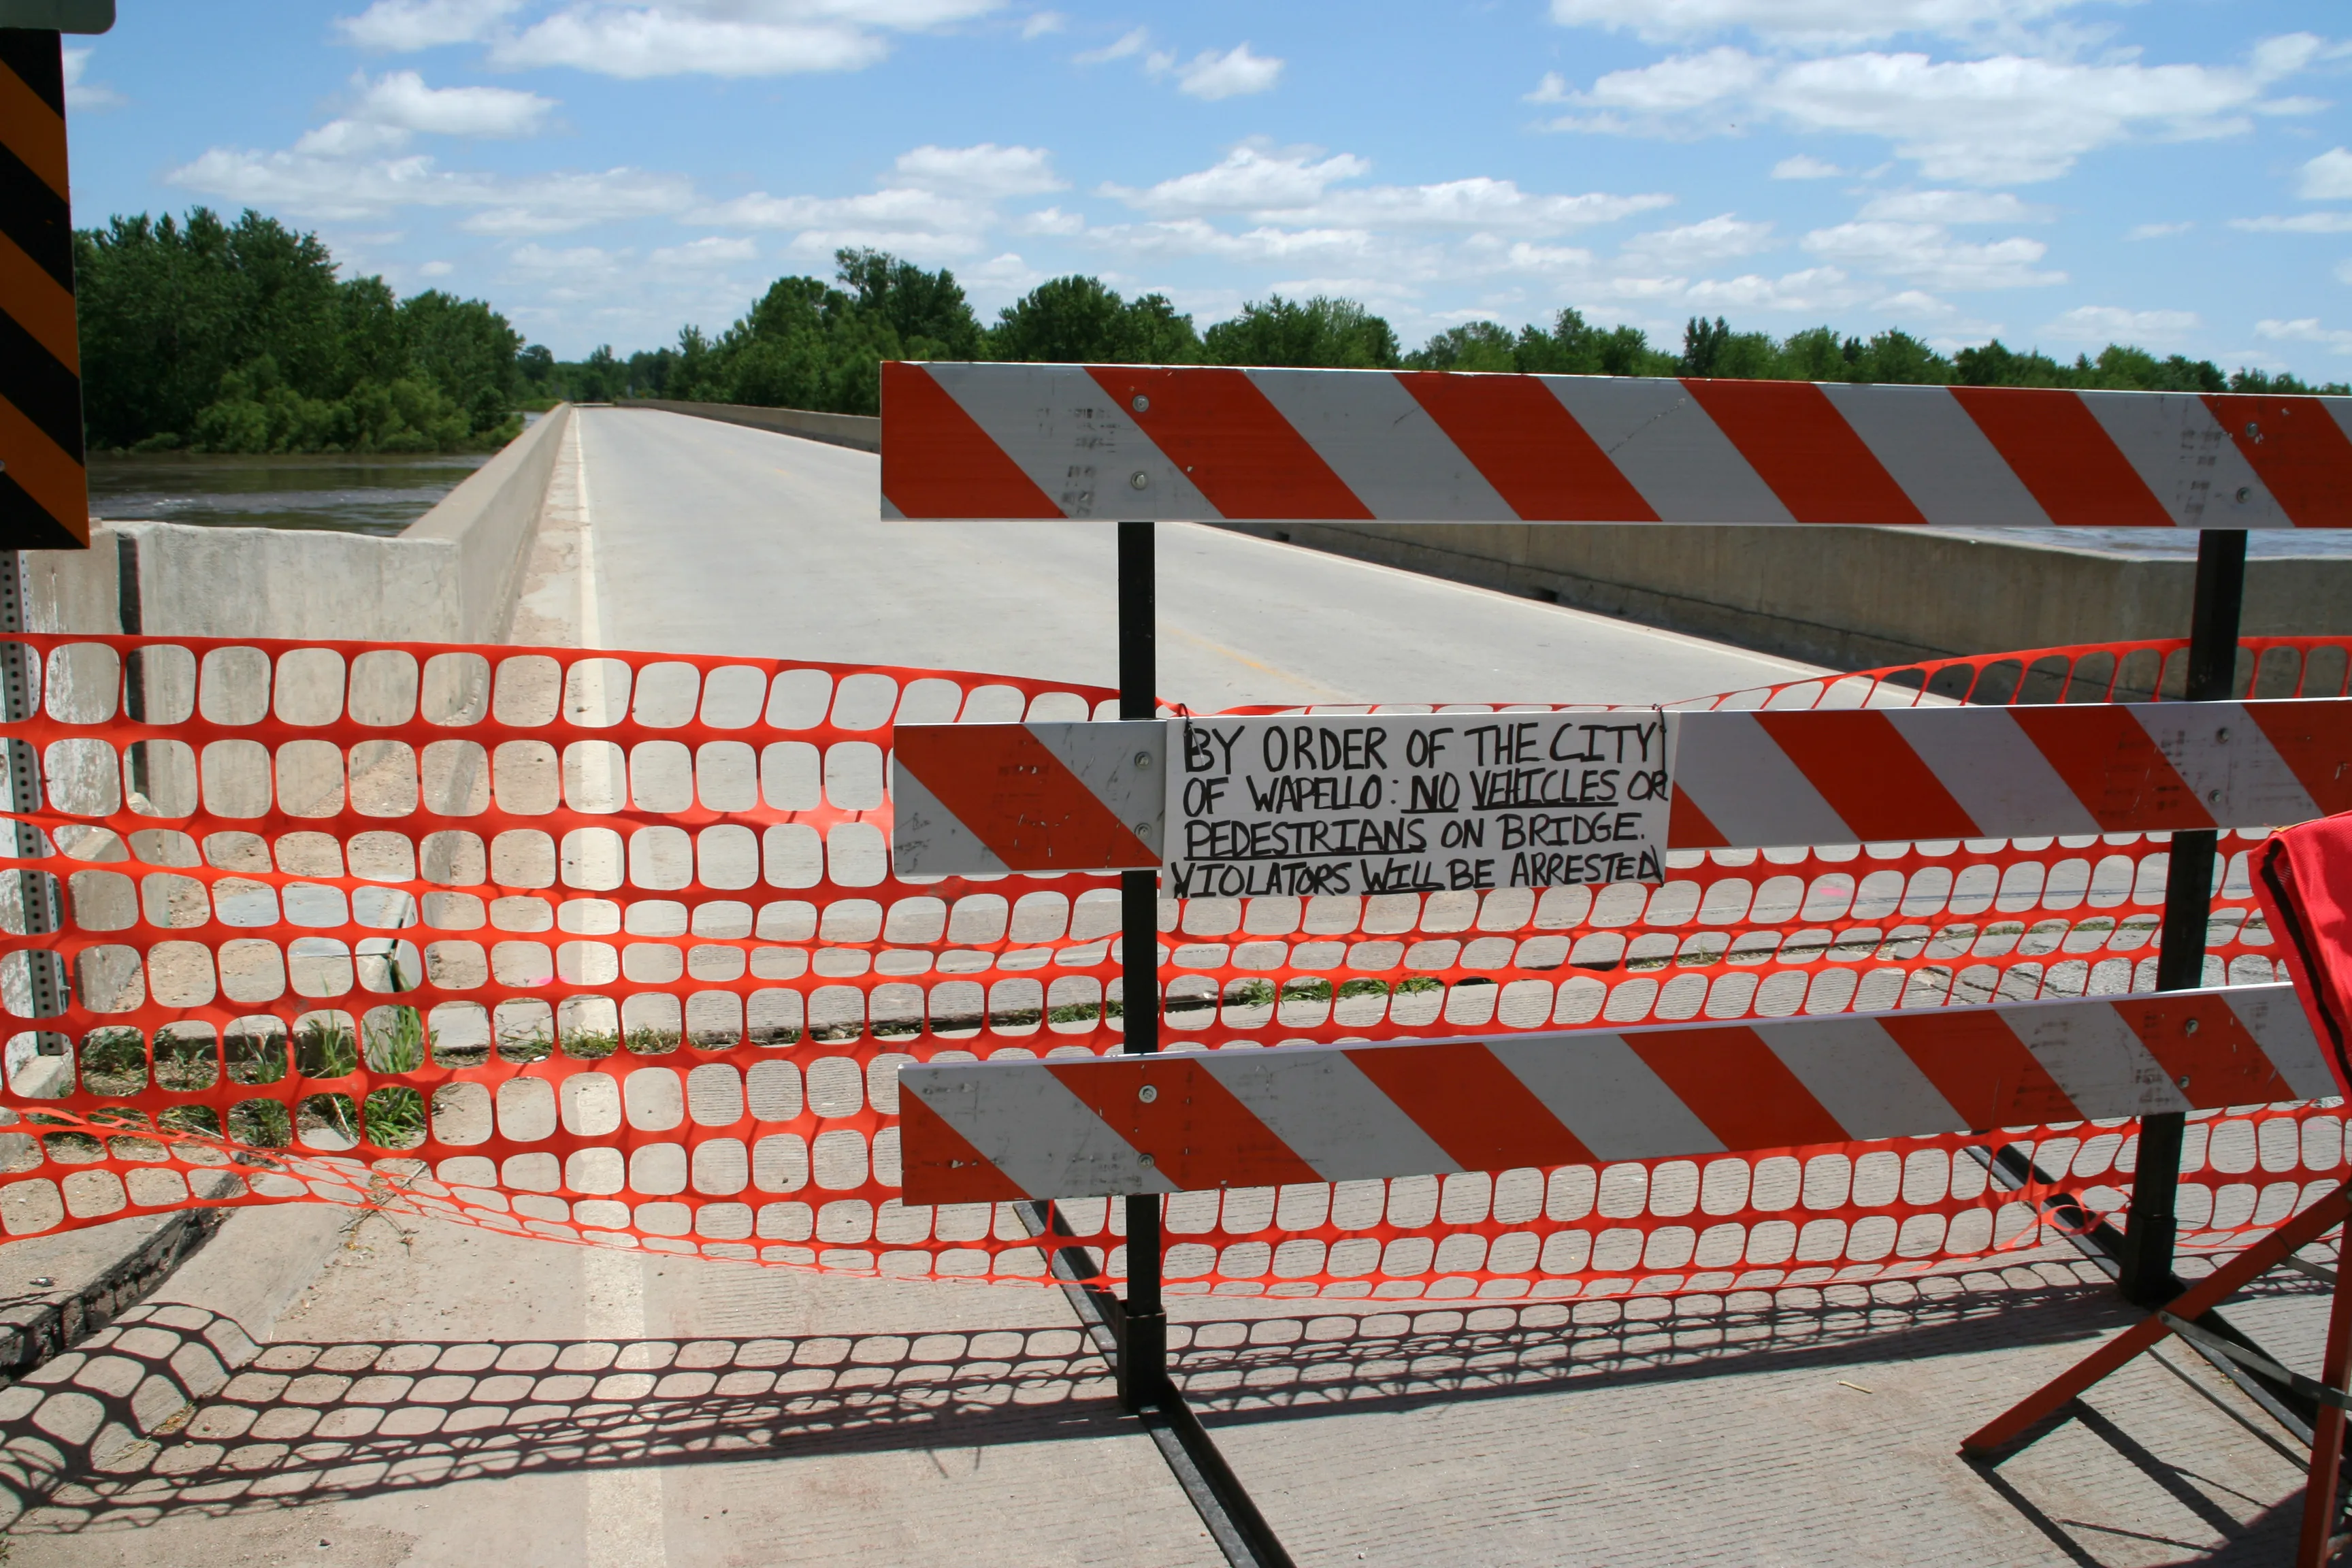
Never Drive Through Floodwater
This is the number-one cause of flood deaths. Just 6 inches (150 mm) of moving water can knock down an adult; 12 inches (300 mm) can sweep away a car. Even shallow water can hide downed power lines, debris, or a washed-out section of road. Turn around, don't drown: if a road is flooded, take another route, even if it costs you thirty minutes.
Purchase Flood Insurance
Standard homeowners and renters policies generally exclude flooding. NFIP policies usually have a 30-day waiting period, with exceptions; private-policy terms vary. Premiums depend on property-specific risk and coverage, so obtain a quote rather than relying on a generic range.6
Evacuate Low-Lying Areas Early
If you live in a low-lying spot, near a river, or in a flood zone, leave before the heavy rain begins. Waiting until the water is up is dangerous: roads go impassable quickly, and rescuers may not reach you for days. Leave early, stay with family or in a shelter, and come back only once officials say it's safe.
Sources
-
Rappaport, E. N. (2014). Fatalities in the United States from Atlantic tropical cyclones: New data and interpretation. Bulletin of the American Meteorological Society, 95(3), 341–346. https://doi.org/10.1175/BAMS-D-12-00074.1 ↩
-
Lonfat, M., Marks, F. D., & Chen, S. S. (2004). Precipitation distribution in tropical cyclones using the TRMM microwave imager: a global perspective. Monthly Weather Review, 132(7), 1645–1660. https://doi.org/10.1175/1520-0493(2004)132%3C1645:PDITCU%3E2.0.CO;2 ↩ ↩2
-
Villarini, G., Goska, R., Smith, J. A., & Vecchi, G. A. (2014). North Atlantic tropical cyclones and U.S. flooding. Bulletin of the American Meteorological Society, 95(9), 1381–1388. https://doi.org/10.1175/BAMS-D-13-00060.1 ↩
-
National Weather Service. (2024). Inland Flooding from Tropical Cyclones. NOAA. https://www.weather.gov/safety/flood-tropicalcyclone ↩ ↩2
-
NWS Houston/Galveston. Tropical Storm Allison. https://www.weather.gov/hgx/projects_allison01 ↩
-
NFIP. Flood insurance. https://www.floodsmart.gov/flood-insurance ↩